
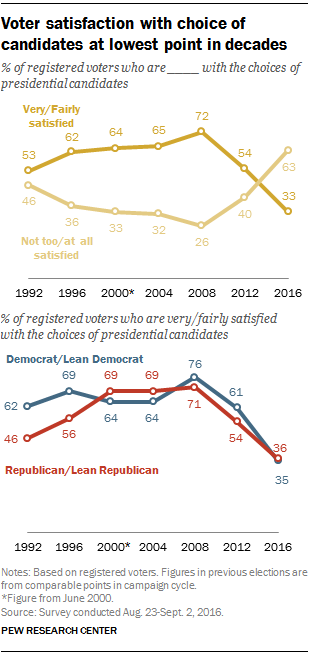
Voter satisfaction with the choice of presidential candidates, already at a two-decade low, has declined even further. A new survey finds that just a third of registered voters say they are very or fairly satisfied with the choices, while 63% say they are not too or not at all satisfied. That represents a 7-percentage-point drop since June in the share of voters expressing satisfaction with their candidate choices.
This marks the first time in six presidential contests since 1992 that positive views of the choice of candidates have shown a significant decline over the course of the campaign (no comparative data are available for the 2000 campaign).
The latest national survey by Pew Research Center, conducted Aug. 23-Sept. 2 among 1,201 adults, including 947 registered voters, finds that unhappiness with this year’s choices crosses partisan lines: Just 36% of Republican and Republican-leaning registered voters, and 35% of Democrats and Democratic leaners, say they are satisfied with their choices.
In prior campaigns, voter satisfaction with the selection of candidates either increased or held steady as Election Day drew closer. At this point in the campaign four years ago, 54% of registered voters said they were very or fairly satisfied with the choice of candidates, which was little changed from June of that year (56%).
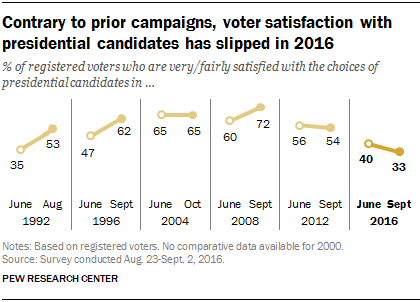
In 2008, voters’ satisfaction with their options increased from 60% to 72% between June and September. In 2004, the share of positive views of candidate choices, which was already high in June (65%), was unchanged three months later.
In 1996, the share of voters who were at least fairly satisfied with the choice of candidates increased 15 percentage points between June and September (from 47% to 62%). And in 1992, satisfaction in June was as at a low point historically (35%) but rose to 53% in August.
Both Republican and Democratic voters express lower levels of satisfaction with their choices of presidential candidates today than at this point in recent elections.
Among Republicans and Republican-leaning independents, 36% say they are very or fairly satisfied, while 59% are not too or at all satisfied. Four years ago, a narrow majority of Republicans were satisfied (54%), while fewer said they were not too or not at all satisfied (42%). Republican voters were far likelier to voice satisfaction with their choices of candidates in 2000 (69%), 2004 (69%) and 2008 (71%).
Wide majorities of Democrats and Democratic leaners have expressed satisfaction with their candidate choices in late summer or early fall in cycles dating back to 1992. Today, however, by 61% to 35%, more Democrats today say they are not satisfied than say they are at least fairly satisfied.
Most view campaign as interesting, but not focused on key policy debates
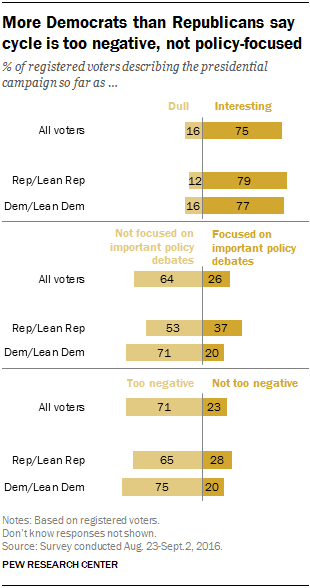
In addition to pervasive dissatisfaction among voters with the candidates, most see the 2016 campaign as too negative and not focused on important policy debates.
Still, three-quarters think this year’s campaign is interesting, including comparable shares of Republicans (79%) and Democrats (77%). Far fewer voters describe the campaign as dull (16%). Compared with past cycles, the share describing the campaign as interesting rather than dull is far greater today than at this point four years ago, but it is on par with the 2008 campaign.
About two-thirds of voters also describe this campaign as not focused on important policy debates (64%), while roughly a quarter (26%) say it is focused on important debates.
This view is more widely held by Democrats than Republicans. By more than three-to-one, more Democrats and leaners think the campaign is not focused on important policy debates (71% vs. 20%). While a narrow majority of Republicans say the same (53%), 37% describe the campaign as focused on important policy debates.
Voters also are more likely to say the campaign so far is too negative than to say it is not (71% vs. 23%). Across party lines, majorities of Democrats (75%) and Republicans (65%) describe the campaign this way.
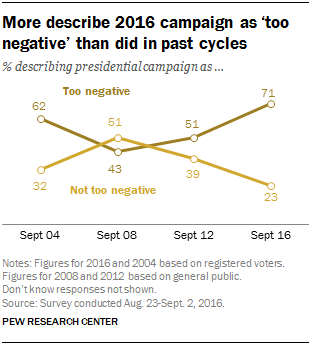
More see this year’s campaign as too negative than in recent election cycles. The share saying this now (71%) is 20 points higher than it was in September 2012, when just about half thought the campaign was too negative, and is up 28 points from September 2008, when more thought that the campaign was not too negative (51%) than said it was (43%).
In 2004, a somewhat smaller majority of voters described the campaign as too negative (62%) than say so now.
Note: Full methodology and topline are available here.