

(Related posts: How we adopted Kubernetes for our data science infrastructure, How we review code at Pew Research Center, How Pew Research Center uses git and GitHub for version control)
Pew Research Center has done survey research and demographic analysis for many years. But in 2015, the Center decided to venture into the world of computational social science, creating a Data Labs team to lead that charge. This required us to develop new tools and workflows that were very different from what we used in our traditional survey and demographic research.
Building the Data Labs team came with a huge number of known and unknown challenges. For instance, we had to adopt an entirely new and rapidly evolving discipline of social science research and integrate the values and norms of that field into an organization with a deeply rooted culture in a separate discipline.
But we also had to contend with more practical questions, including a fundamental one: How do we actually do this kind of work? Survey research at the Center typically involves performing statistical analyses on clean, static data files that might require some degree of post processing — but which tends not to change much once a survey field period is over. Due to their relatively small size, these analyses can usually be performed using statistical packages like SPSS or Stata, which can live on staffers’ local machines. We had very little experience working with the massive, constantly evolving and messy datasets that are the hallmarks of data science research, and the many new tools and languages we needed to work with them.
Over the years, we’ve created a fully functioning data science infrastructure to support the efforts of our research staff. Some of our efforts have worked better than others, but even our successes have required constant adaptation to keep pace with the field and with the needs of our researchers. In a series of posts, we’ll talk about what we did and what we learned over the course of that process. This inaugural post will start with the basics — the collaborative workspaces that our data scientists rely on for their day-to-day activities.
Defining our core infrastructure needs
We first needed to establish a key set of metrics that could serve as a “North Star” for how to interface with the Data Labs team’s tools and datasets. These were some of the key elements guiding that effort:
We needed to move fast. As is the case for many organizations, our IT resources are centralized under one department, which employs rigorous protocols for managing and securing our computers. This presents a challenge for a startup team in immediate need of computational resources but still in the process of identifying and building the infrastructure we would later need to manage. By building our own tools, we knew we could tailor them to fit our exact workflow while also protecting the rest of Pew Research Center’s operational infrastructure.
We needed a solution that could accommodate a wide range of programming languages, researcher skill sets, desktop environments and types of data. The Data Labs team is fluent in a number of programming languages and tools. These include industry-standard languages like R and Python, as well as some proprietary statistical software. We use them to collect and analyze data from many different sources — social media posts, collections of YouTube videos, the text of sermons scraped from church websites and more.
We needed to support our “power users” while also facilitating collaboration with non-data scientists. Our advanced users needed to be able to operate a complete data science pipeline from data collection and processing through analysis and publication. But the Data Labs team also collaborates with researchers across all of Pew Research Center, many of whom may not be trained in newer data science tools. As a result, it was imperative to provide a “batteries included” user experience for researchers who are just getting started with core data science tools. That meant relying on an easily deployed and consistent data environment.
Security was non-negotiable. Like any other organization involved in data collection, we put a premium on data security; we needed to provide access in a way that didn’t require users to have complete administrator-level control over their laptops or the burden of maintaining a programmer-style developer environment. We also wanted to be sure that users were uniquely identified and could have resource profiles and configurations supplied depending on their individual user account and research needs.
Our tool of choice: Jupyter notebooks
Based on the above criteria, we quickly narrowed our focus to web-based tools rather than software installed on users’ personal machines. These web-based applications are easily accessible via a standard browser window and provide a simple connection to cloud-based computing resources. They also allow our DevOps team to monitor and manage user sessions and integrate enterprise user management and file storage tools in a consistent, secure environment. As a bonus, they are simpler to build and deploy than most desktop applications.
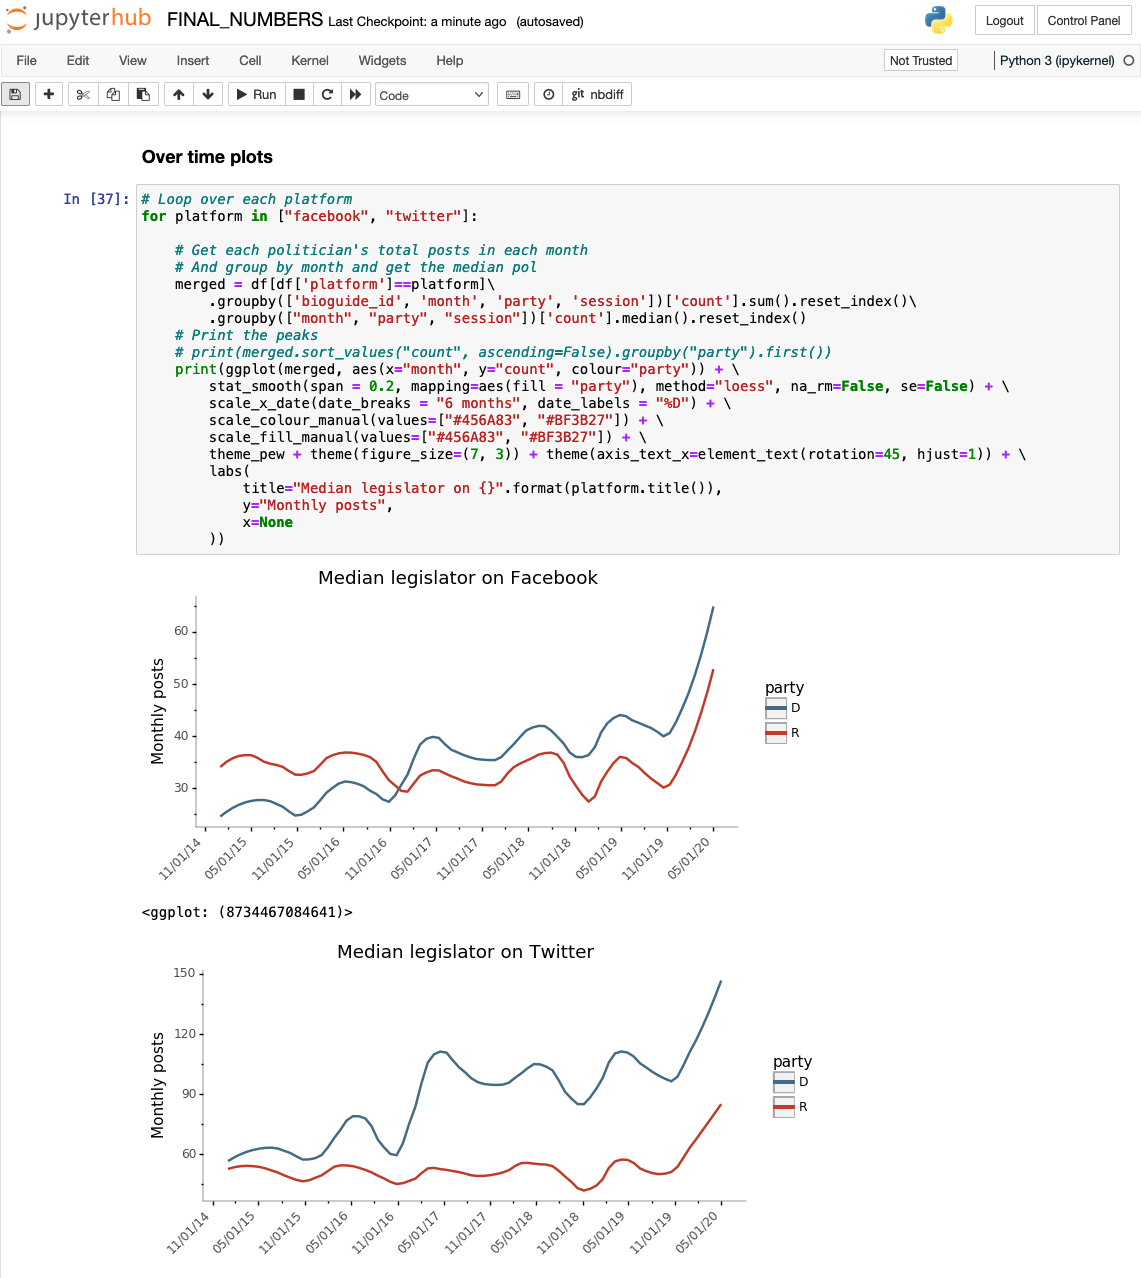
After exploring some options, we settled on a tool called Jupyter as the team’s primary platform for data-wrangling and analysis. Jupyter is an open-source web application that allows researchers to write and execute scripts in many languages. It provides an intuitive and interactive notebook interface that integrates code and output as cells. This gives researchers the ability to work through scripts line-by-line and combine the code itself with its output, text, tables and graphics in the same document.
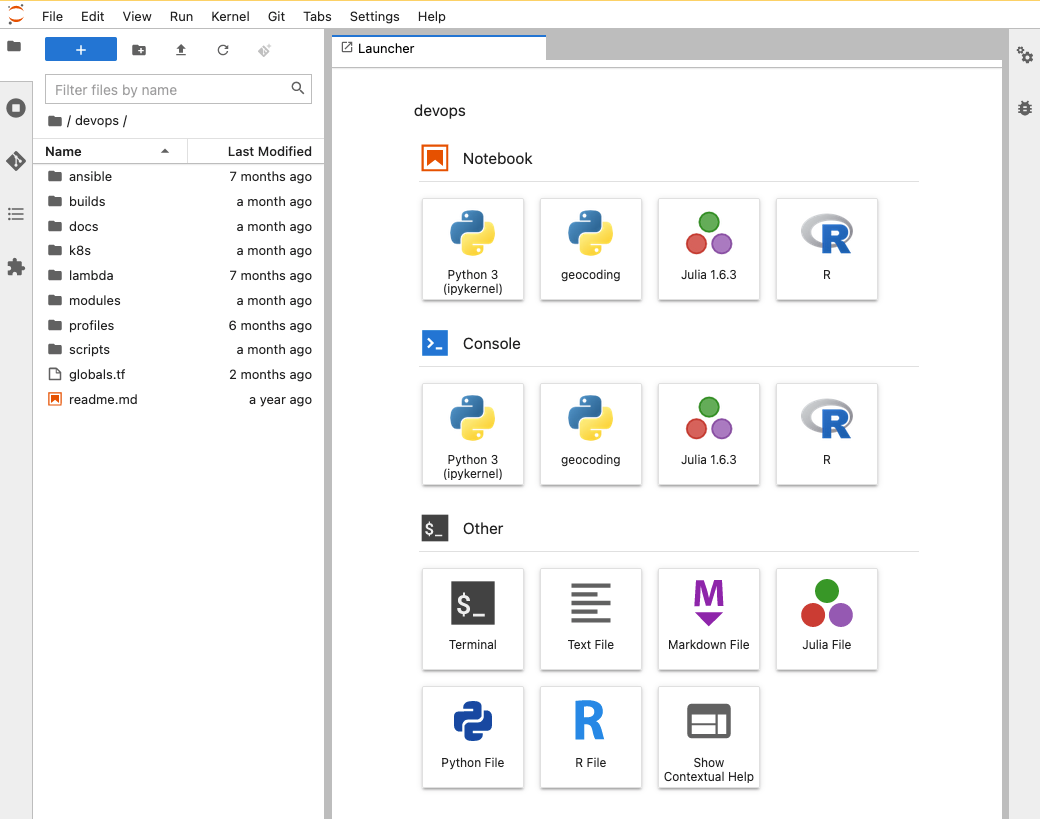
Simply put, Jupyter gave us much of what we were looking for: a highly customizable and (relatively) low-barrier-to-entry system that could be used by anyone across the organization without special administrator privileges. In the years since our initial decision, our Jupyter implementation has evolved in both complexity and capacity to meet the needs of the Data Labs team and broader Pew Research Center.
Phase 1: Jupyter notebooks as a standardized interface for processing and analysis
In the early days of Data Labs, our priority was getting the team up to speed with a functional working environment before adding too many bells and whistles, but we still needed to collaborate in the same space. To boot up quickly, we installed the single-user version of Jupyter on a dedicated server and gave all the members of the team common access to the files and libraries stored there, using a shared token.
However, we quickly ran into issues as people on the team began to interact more with each other. Having a single instance of Jupyter serving notebooks to all users was easy, but the shared credentials and the lack of isolation between users presented obvious security risks. If one researcher needed to run a computationally intensive model they could end up draining all the resources available for other users, and updates to one package could break a co-worker’s analysis. Managing this infrastructure also posed problems for our engineering team, since changes to the underlying server were guaranteed to interrupt everyone’s work.
We quickly realized that running the “single user” version of Jupyter on a dedicated server wasn’t going to cut it, and that we needed something more scalable.
Phase 2: JupyterHub as a collaborative workspace
As a solution, we could have gone with a proprietary vendor product similar to Jupyter notebooks, giving each researcher their own account and environment, and the vendor would deal with the problem of managing resources on our behalf. Unfortunately, this would not work for us due to our tightly integrated data sources in our private cloud environment, our general approach to collaboration relying on a shared file system, and the extensive package library we rely on. Instead, we chose to deploy our own version of the open-source JupyterHub project on its own server. JupyterHub manages individual notebook sessions and acts as a central gateway for logins and API access. Hosting the service ourselves did place an added burden on the engineering team, but it also allowed greater customization of the user environment and the ability to retain full control over our data without locking ourselves into proprietary services or ongoing licensing costs.
Phase 3: Scaling and enhancing our JupyterHub setup
After settling on JupyterHub as our standard gateway for data science at the Center, we have since focused on making the system work more smoothly for our growing cadre of users. As the team started doing more (and more computationally intensive) work, our researchers again began to be limited by resource constraints. While it was easy to add more resources to the single server running JupyterHub, it meant interrupting tasks with a reboot, and our DevOps team was spending more and more time playing “whack-a-mole” with highly volatile, resource-intensive scripts manipulating huge amounts of data. We needed a better way to scale resources where they were needed in an on-demand way.
In our case, we did this using by running JupyterHub on a managed cluster of instances, using an orchestration tool called Kubernetes (which we will dive into in another post). The fundamental concept behind this tool is a technology known as containers, which create mostly isolated spaces that allow our data scientists to work in consistent, preconfigured environments with a comprehensive toolkit at their disposal, but also allow for selective connections between spaces. Containers also leverage individual user accounts to let us offer different quantities of computing power and memory, or different sets of packages as “profiles” which can be activated on demand by researchers in their notebooks. This approach makes it possible for notebooks to be distributed across a cluster of machines dynamically as they need more resources and allows us to guarantee resource availability for sensitive workloads.
Takeaways and lessons learned
The data science community relies on many tools that are public utilities constructed and maintained by data scientists themselves. Reducing barriers to entry and aligning our toolkit with the broader community is a tremendous advantage for bringing new team members up to speed and engaging with the rest of the organization and field. And Jupyter’s active developer community is a public source of plugins to augment the base functionality of the server to fit specific needs of our workflow (e.g., tools to examine variables in memory, maintain notebooks under better version control and support inline code linting).
Of course, this process has not been without its challenges. For instance, Jupyter is primarily a web service, but our researchers often need to run commands and scripts through the command line — for which using a browser tab is not ideal. As a result, one of our future goals is to improve the integration of Jupyter with local desktop applications while continuing to use it as a remote environment and resource manager.
In the end, we achieved what we set out to do by implementing a general-purpose, community-maintained analysis platform that provides a consistent web-based experience that is easy to pick up and use. Jupyter itself acts only as the door to many important components of our infrastructure, and in future posts we’ll go into more detail about the mechanics behind our container orchestration and other tools we’ve incorporated.