
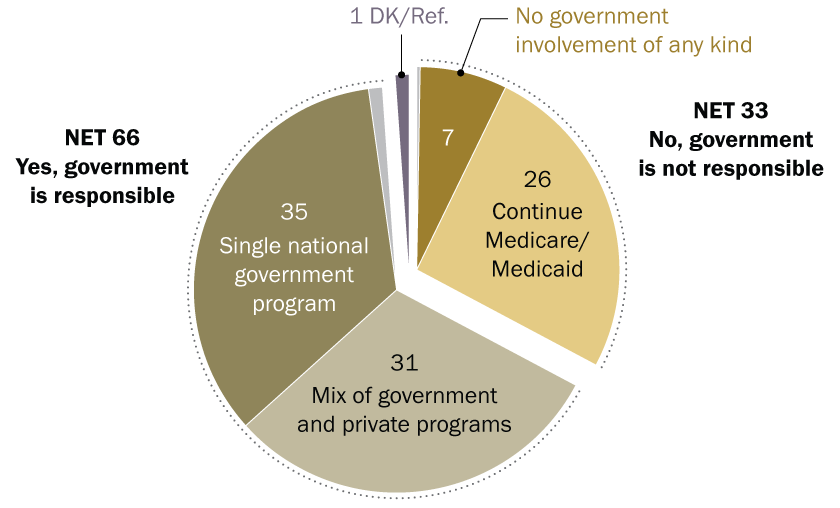
Most Americans (66%) say the federal government has a responsibility to make sure all Americans have health care coverage. Far fewer (33%) say it does not, according to a Pew Research Center survey conducted Nov. 17-30, 2025, among 10,357 U.S. adults.
Source: Survey of U.S. adults conducted Nov. 17-30, 2025.
| Share | |
|---|---|
| No government involvement of any kind | 7 |
| Continue Medicare/Medicaid | 26 |
| Mix of government and private programs | 31 |
| Single national government program | 35 |
| Yes, government is responsible, DK/Ref. | 1 |
| No, government is not responsible, DK/Ref. | <1 |
| DK/Ref. | 1 |
Source: Survey of U.S. adults conducted Nov. 17-30, 2025.
Yet those who say the federal government has this responsibility are split over how it should ensure coverage:
- 35% of all adults favor a single national health insurance system run by the government.
- 31% say insurance should continue to be provided through a mix of private companies and government programs.
Most of those who say the federal government is not responsible for ensuring coverage say it should continue to cover seniors and the very poor through Medicare and Medicaid:
- 26% of all adults say these programs should continue.
- 7% say the federal government should not be involved in providing health insurance at all.
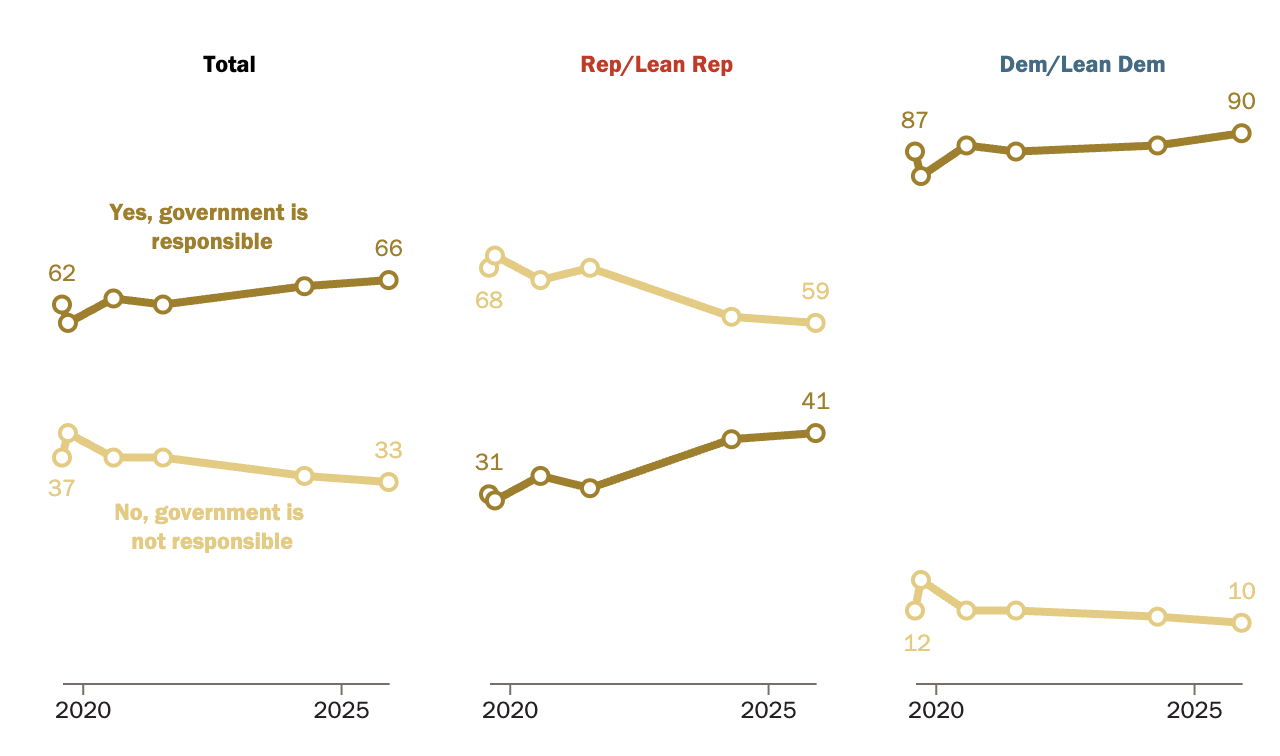
These views are essentially unchanged over the last year. Still, the share of adults who say the government has a responsibility to make sure all Americans have health coverage remains modestly higher than it was a few years ago (62% in 2021). That primarily reflects a shift in Republicans’ views.
A 59% majority of Republicans and Republican-leaning independents say the federal government is not responsible for ensuring health coverage for all, while 41% say it is. Republicans’ views haven’t changed since last year, but the share who say government has this responsibility is 9 percentage points higher than in 2021.
Meanwhile, 90% of Democrats and Democratic leaners say the government has a responsibility to ensure coverage. This includes 52% who say the government should run a single national insurance program and 37% who prefer the current mix of private insurance and government programs. One-in-ten Democrats say the government does not have the responsibility to ensure health care coverage. These views haven’t changed much in recent years.
Source: Survey of U.S. adults conducted Nov. 17-30, 2025.
| Date | Yes, government is responsible | No government is not responsible | |
|---|---|---|---|
| Total | 11/30/25 | 66 | 33 |
| Total | 4/14/24 | 65 | 34 |
| Total | 7/18/21 | 62 | 37 |
| Total | 8/2/20 | 63 | 37 |
| Total | 9/15/19 | 59 | 41 |
| Total | 8/4/19 | 62 | 37 |
| Rep/Lean Rep | 11/30/25 | 41 | 59 |
| Rep/Lean Rep | 4/14/24 | 40 | 60 |
| Rep/Lean Rep | 7/18/21 | 32 | 68 |
| Rep/Lean Rep | 8/2/20 | 34 | 66 |
| Rep/Lean Rep | 9/15/19 | 30 | 70 |
| Rep/Lean Rep | 8/4/19 | 31 | 68 |
| Dem/Lean Dem | 11/30/25 | 90 | 10 |
| Dem/Lean Dem | 4/14/24 | 88 | 11 |
| Dem/Lean Dem | 7/18/21 | 87 | 12 |
| Dem/Lean Dem | 8/2/20 | 88 | 12 |
| Dem/Lean Dem | 9/15/19 | 83 | 17 |
| Dem/Lean Dem | 8/4/19 | 87 | 12 |
Source: Survey of U.S. adults conducted Nov. 17-30, 2025.
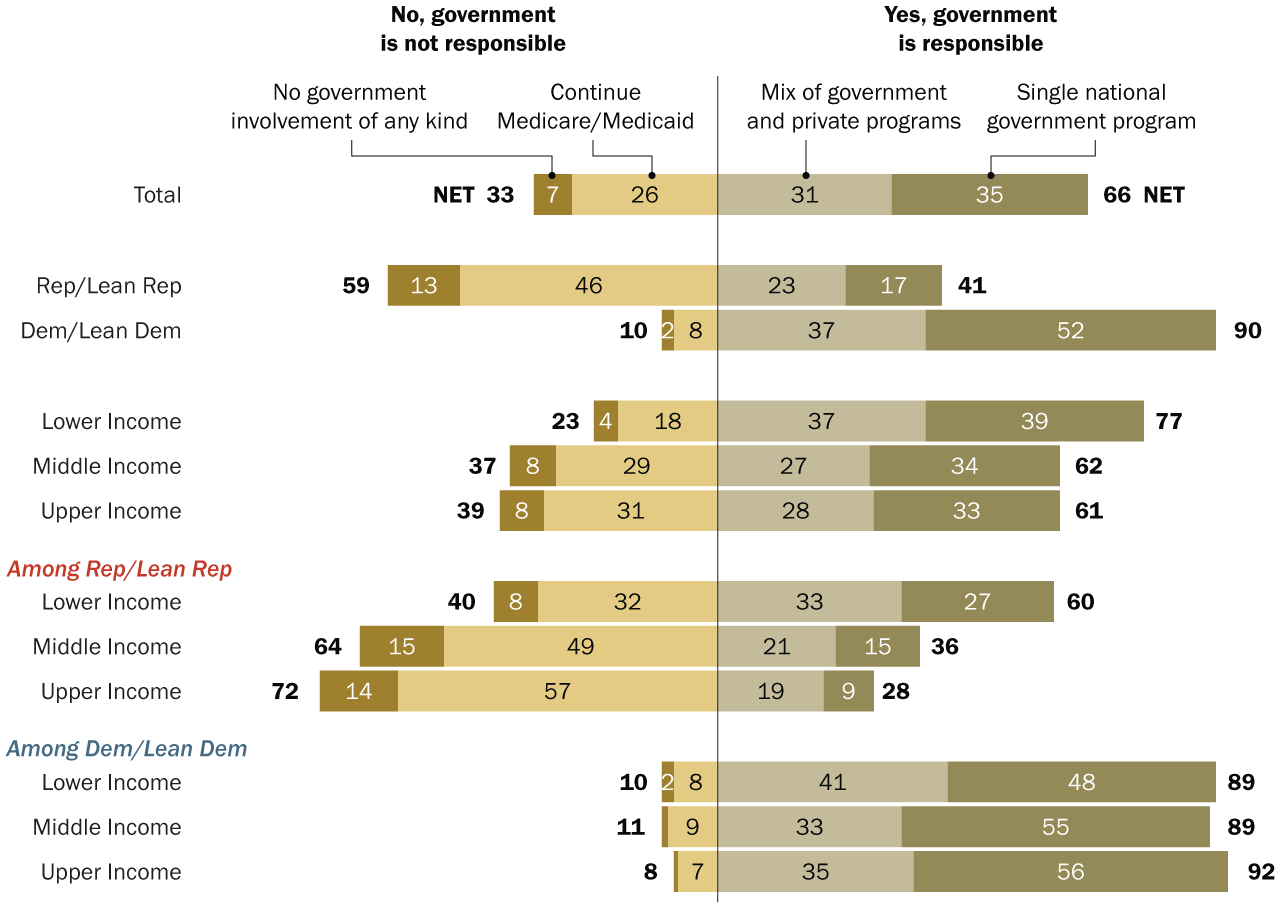
How views differ across demographic groups
Majorities of Americans across income levels say the federal government has a responsibility to make sure all Americans have health care coverage. However, adults in lower-income households are particularly likely to say this.
There are wide differences between higher- and lower-income Republicans on this question:
- 60% of Republicans with lower incomes say ensuring health coverage for all is the federal government’s responsibility. This includes 27% who say this should be done through a single national insurance program.
- Far smaller shares of Republicans with middle incomes (36%) and upper incomes (28%) say the government has this responsibility.
Source: Survey of U.S. adults conducted Nov. 17-30, 2025.
| NET Yes, government is responsible | Single national government program | Mix of government and private programs | Continue Medicare/Medicaid | No government involvement of any kind | NET No government is not responsible | |
|---|---|---|---|---|---|---|
| Total | 66 | 35 | 31 | 26 | 7 | 33 |
| Rep/Lean Rep | 41 | 17 | 23 | 46 | 13 | 59 |
| Dem/Lean Dem | 90 | 52 | 37 | 8 | 2 | 10 |
| Lower Income | 77 | 39 | 37 | 18 | 4 | 23 |
| Middle Income | 62 | 34 | 27 | 29 | 8 | 37 |
| Upper Income | 61 | 33 | 28 | 31 | 8 | 39 |
| Rep/Lean Rep Lower Income | 60 | 27 | 33 | 32 | 8 | 40 |
| Rep/Lean Rep Middle Income | 36 | 15 | 21 | 49 | 15 | 64 |
| Rep/Lean Rep Upper Income | 28 | 9 | 19 | 57 | 14 | 72 |
| Dem/Lean Dem Lower Income | 89 | 48 | 41 | 8 | 2 | 10 |
| Dem/Lean Dem Middle Income | 89 | 55 | 33 | 9 | 1 | 11 |
| Dem/Lean Dem Upper Income | 92 | 56 | 35 | 7 | 1 | 8 |
Source: Survey of U.S. adults conducted Nov. 17-30, 2025.
By contrast, overwhelming majorities of Democrats at all income levels say the federal government is responsible for ensuring health coverage for all. Still, there are modest differences in views of how this should happen:
- Majorities of middle-income (55%) and upper-income Democrats (56%) say a single national program should provide insurance for all Americans.
- Fewer Democrats with lower incomes (48%) say this.
Americans’ views on whether the federal government has a responsibility to ensure all Americans have health care coverage also vary across other demographic categories, including race and ethnicity, age, and education.
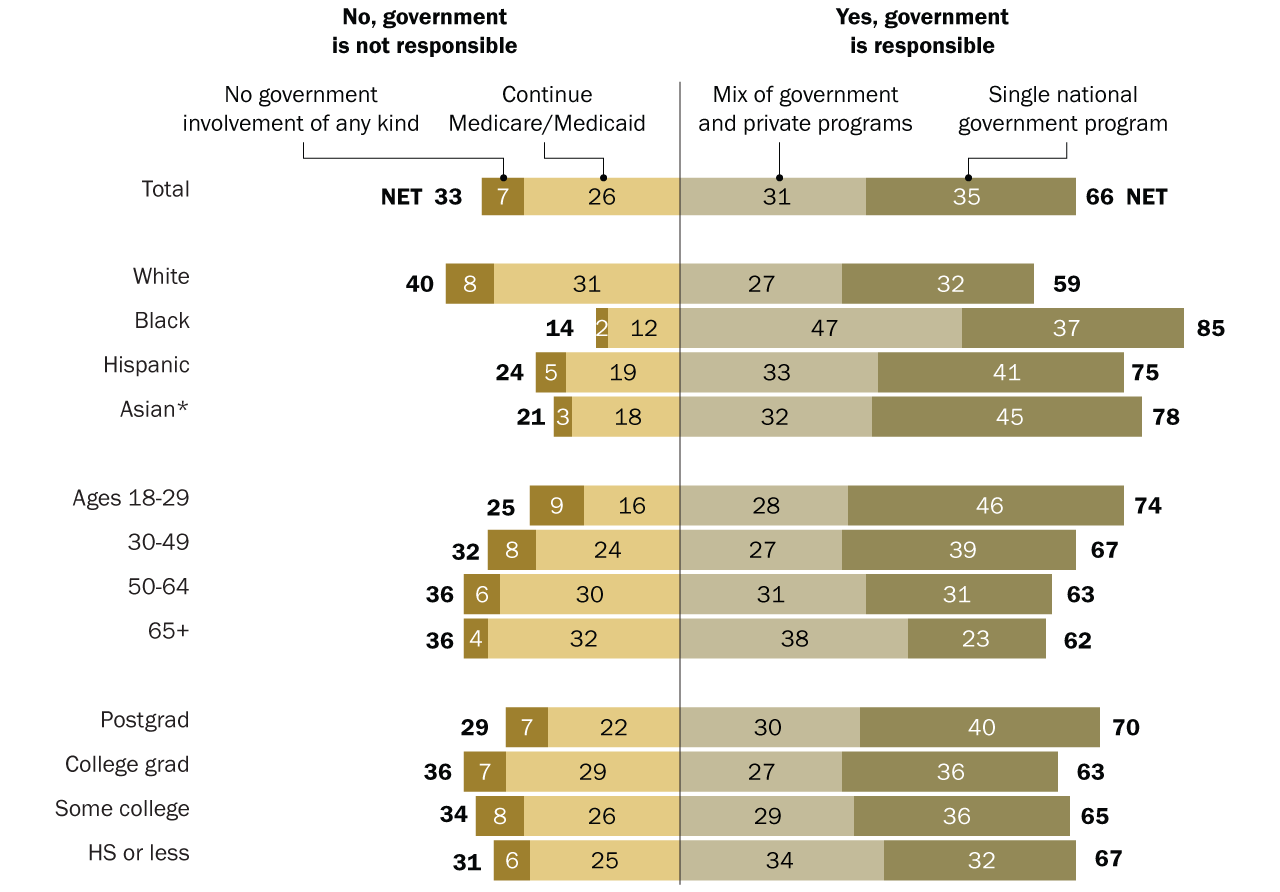
Note: White, Black and Asian adults include only those who report being one race and are not Hispanic. Hispanics are of any race. No answer responses are not shown.
Source: Survey of U.S. adults conducted Nov. 17-30, 2025.
| NET Yes, government is responsible | Single national government program | Mix of government and private programs | Continue Medicare/Medicaid | No government involvement of any kind | NET No, government is not responsible | |
|---|---|---|---|---|---|---|
| Total | 66 | 35 | 31 | 26 | 7 | 33 |
| White | 59 | 32 | 27 | 31 | 8 | 40 |
| Black | 85 | 37 | 47 | 12 | 2 | 14 |
| Hispanic | 75 | 41 | 33 | 19 | 5 | 24 |
| Asian* | 78 | 45 | 32 | 18 | 3 | 21 |
| Ages 18-29 | 74 | 46 | 28 | 16 | 9 | 25 |
| 30-49 | 67 | 39 | 27 | 24 | 8 | 32 |
| 50-64 | 63 | 31 | 31 | 30 | 6 | 36 |
| 65+ | 62 | 23 | 38 | 32 | 4 | 36 |
| Postgrad | 70 | 40 | 30 | 22 | 7 | 29 |
| College grad | 63 | 36 | 27 | 29 | 7 | 36 |
| Some college | 65 | 36 | 29 | 26 | 8 | 34 |
| HS or less | 67 | 32 | 34 | 25 | 6 | 31 |
Note: White, Black and Asian adults include only those who report being one race and are not Hispanic. Hispanics are of any race. No answer responses are not shown.
Source: Survey of U.S. adults conducted Nov. 17-30, 2025.
Note: This is an update of an analysis originally published on Sept. 29, 2020. Here are the questions used for this analysis, the topline and the survey methodology.
