

The Pew Research Center often receives questions from visitors to our site and users of our studies about our findings and how the research behind them is carried out. In a new feature, senior research staff will answer questions relating to all the areas covered by our seven projects ranging from polling techniques and findings, to media, technology, religious, demographic and global attitudes trends. We can’t promise to respond to all the questions that we receive from you, our readers, but we will try to provide answers to the most frequently received inquiries as well as to those that raise issues of particular interest.
If you have a question about our work, please send it to info@pewresearch.org.
Jump to a question:
- Aren’t many Millennials just being “politically correct” in answering racial questions?
- Why won’t you pay me to answer your poll questions?
- Is it likely that readers will be willing to pay for news online?
- Why do many of the questions on your quizzes begin with the phrase: “Do you happen to know….?”
- Do people in other counties find Americans polite?
- Can you really gauge the sentiments of the total U.S. population with such small samples?
- Why are there fewer bloggers these days?
- Is caller ID is increasing non-response rates in your surveys?
- Does anyone ever click on all those online ads?
- Can I volunteer to be picked for a survey?
- How do you decide how to word your survey questions?
- Why does the Census ask for your age?
- Does Google affect the way people get their news?
- How does the Census know its participate rate?
- What does “PEW” stand for?
- How are pollsters able to determine whether an American is a liberal, moderate or conservative?
- Are adults with only a cell phone represented in your polls?
- Isn’t the real unemployment rate much higher than you say it is in your news quiz?
- How does the Pew Internet & American Life Project choose the topics that it researches?
And for even more “Ask the Expert” questions click here.
Q. I am reading the trends reported on the website dedicated to the “Millennial Generation,” of which I am a part (born 1984). There is a lot of interesting information and data regarding a wide range of topics. However, I am curious to know if any deeper research has been performed to back the claim that Millennials are more accepting of racial/ethnic/cultural diversity.
In my opinion, I think Millennials have been trained to provide “politically correct” answers when discussing issues of race and ethnicity that hide their true feelings. While the survey results in “Millennials’ Judgments About Recent Trends Not So Different” states that 67% of interview respondents believed that diversity is a positive thing, that contradicts the vitriolic racism rampant in comment sections on websites, message boards, and other mediums where users feel free to convey more honest opinions while hiding behind the anonymity of a screen-name.
I am wondering if there is a way to question interview respondents in a manner that ensures the participant’s anonymity in order to gain more honest answers?
We take great care in all of our surveys to protect the confidentiality of respondents. Nonetheless, they interact with a human voice over the phone, so the phenomenon you ask about may indeed come into play. In survey research circles, it even has a name: social desirability bias, the tendency of respondents to reply to questions on sensitive topics in a manner they think will be viewed favorably by others.
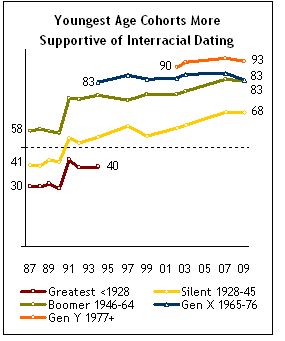
You posit that there may be more of this going on among Millennials than among older respondents. It’s an interesting observation, but we have no way of knowing from our data whether it’s true. On the general topic of racial tolerance and diversity, however, there are a few things we do know. First, all age groups in this country have grown more tolerant over time, and Millennials are the most tolerant of all, as illustrated by the accompanying chart on attitudes about interracial dating. Might there be some social desirability embedded in these responses? Sure. But even if that’s all we’re measuring, it may be its own marker of social progress. Lip service, after all, is one of the tributes we pay to virtue.
We also know that a record 14.6% of all new marriages in the United States in 2008 were between spouses of a difference race or ethnicity from one another — and that the share who intermarry is higher among new spouses in their twenties, thirties and forties than among new spouses who are older. See our recent report on this topic.
None of this proves that there isn’t some social desirability bias in our surveys. But it does illustrate that in some of the most intimate realms of race relations, both attitudes and behaviors are changing. It also suggests that the “vitriolic racism” you’ve encountered in the comment sections of websites is only one aspect of a much more textured — and, on the whole, more positive — story.
Paul Taylor, Executive Vice President, Pew Research Center
Q. One is beseiged, especially at election time, by telephone “pollsters”. My response is: “How much will you pay me for my opinion?” After all, the questioner is being paid, their employer is being paid, and the party requesting the poll is getting valuable information. I am, perhaps, the most important part of the equation. Is it not fair that I be compensated also?
We are very appreciative of the time that our respondents contribute to participate in our polls. The average Pew Research Center survey interviews about 1,500 respondents and takes about 20 minutes to complete. That means respondents as a group are contributing about 500 hours of time to take part. But normally we — and most other polling organizations — do not pay people for the time they spend participating.
The main reason for this is that we see polling as a benefit to the public, and believe that most of our respondents do as well. Polls give people a chance to have their opinions and experiences documented and represented to public officials, policy makers, leaders in various sectors and to the broader public. Polling is not the only way public opinion is registered, but it is an important way and one that is more representative of the population than some other methods, such as letters and calls to public officials, campaign contributions or participation in volunteer organizations.
But there are times when we do compensate respondents. We offer our cell phone respondents a small cash reimbursement because most people have to pay for the minutes they use on their cell phones. When we conduct focus groups that require travel to a central facility and take a couple of hours to complete, we compensate participants to help pay for travel, baby sitting or other expenses. And some surveys that are very long or especially complicated may warrant offering compensation.
Scott Keeter, Director of Survey Research, Pew Research Center
Q. Major news organizations keep complaining that they can no longer afford to pay reporters to cover and report the news since more and more readers are getting their news for free online. Is it likely that internet users would be willing to pay for news?
At the moment our surveys find only a tiny proportion of internet users — 7% — express any willingness to pay for news. That’s not because internet users are uninterested in news: fully 71% of all those online say they get news from the internet. Within that group, however, just 35% say they have a favorite news website and, among those with a favorite site, only 5% say they pay for news content now. Moreover, just 19% say they would be willing to pay if that favorite site started charging for access to its content.
In other words, when we asked people who have a favorite website if they would pay for access to that site if it erected a pay wall, 82% said they would not return to the site and would go elsewhere for their news. And those are the people who like that website enough to call it a favorite. This reluctance poses huge challenges to news sites that want to erect a pay wall and add subscription fees for access to their online offerings.
Lee Rainie, Director, Internet & American Life Project
Q. Why do many of the questions on your quizzes begin with the phrase: “Do you happen to know….?” Strictly speaking, the correct answer to a question phrased that way is either YES or NO. All of the multiple choice options are not correct responses in these cases as they would be if the questions were posed directly, e.g., What is the national unemployment rate? How many votes are needed to break a filibuster? etc.
While the way these questions are constructed is formally incorrect, we do this intentionally. First, it is important to remember that our online interactive news quiz is a companion to a national telephone survey the Pew Research Center conducts to test the political knowledge of Americans. To get an accurate estimate of political knowledge when testing the public over the telephone, we must make it clear to respondents that they have the option to say that they do not know an answer to a question.
We use this language to emphasize that it’s perfectly legitimate if a respondent doesn’t “happen to know” the answer. Our research tends to find that the share of Americans who closely track political issues is relatively small. For the rest, some or most of our “quiz” questions are about topics they may never have heard about, and we want to make it clear that not knowing the answer to the question is fine. In fact, when asked if they “happen to know” something, many people simply respond “No” and we take them at their word and move on to the next question. If a more knowledgeable survey respondent answers the question literally and says “Yes, I do know that,” our interviewers probe by asking which of the options is the correct answer.
Another approach to reducing the pressure on people when asking factual questions is to offer “or don’t you know” as an option among the possible answers. In other words, one might ask: “Is the national unemployment rate closer to 5%, 10%, 15%, 20% or don’t you know?” The concern here, however, is that this question could seriously understate public knowledge, because someone who is pretty sure unemployment is close to 10% but is not absolutely certain of it might choose the “don’t know” option because, literally, they don’t know the answer.
Overall, we want to encourage people who think they know the answer to offer their response, and at the same time reassure people who really don’t know that it’s perfectly fine to say so. As you go through the quiz on the website, you will see that we do not structure every question this way. We attempt to mix in different opening language when conducting the survey on the phone to make the language less repetitive, and to offer an occasional reminder, in as few words as possible, that it’s OK if you don’t know the answer to every question.
Michael Dimock, Associate Director, Pew Research Center for the People & the Press
Q. I am a widely traveled person and I believe that the USA and its people are one of the most polite/courteous people/nationsin the world. Is this view widely shared in other countries?
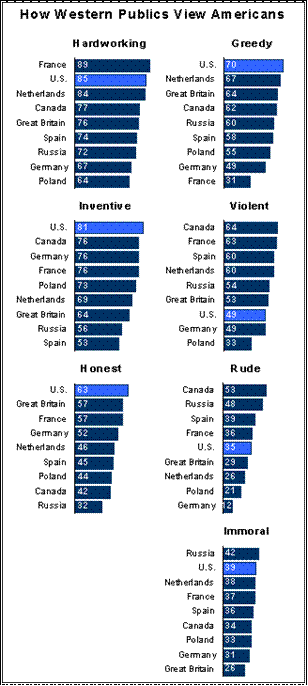
We have indeed gathered other countries’ opinions on the typical characteristics of Americans, most recently in the 2005 Pew Global Attitudes survey. And while the survey did not ask directly about politeness, it did query respondents about the prevalence of the opposing characteristic: rudeness.
As you can see in the accompanying chart, majorities in most Western countries, at least do not view average Americans as rude, despite their perceived tendency toward greed and violence.
Only, in neighboring Canada does a 53%-majority describe Americans as rude. Interestingly, Americans themselves are more likely to assign that negative characteristic to their fellow countrymen (35% do so) than are the residents of Great Britain (29%), the Netherlands (26%) and Poland (21%). And a scant 12% of Germans find Americans lacking in politeness.
Looking farther around the globe, however, one finds other countries that share Canada’s reservations with regard to American gentility. (See chart below). In Turkey, an identical 53% see Americans as rude. This view is shared by larger majorities in Indonesia (56%) and Jordan (64%).
Overall views of the United States as a nation have improved considerably since the 2005 survey was conducted. (For example, from 2003 to 2008, relatively few in Indonesia had a favorable opinion of the U.S.; now a 63%-majority does.)

Whether this improvement has carried over into views of individual traits of Americans is something that we can’t know absent a new survey.
Jodie T. Allen, Senior Editor, Pew Research Center
Q. On “news” sites, one reads daily that “43% surveyed think this,” or “72% of …. name the group” are doing this. Yet, when one performs due diligence, the statistic recedes into non-importance, because so many surveys involve, say, 1,146 respondents. With a population approaching 300 million, how can any responsible news source report such insignificant data?
A lot of people share your skepticism about sampling. It is not intuitively easy to grasp how a very small sample of a very large population can be accurate. But pollsters have a stock (if smart-alec) reply: If you don’t believe in random sampling, ask your doctor to take all of your blood next time you need a blood test. Indeed, sampling is used in many fields — by accountants looking for fraud, medical researchers, even manufacturers doing quality control checks on their products. The key for survey sampling is that every person in the population (in our case, adults living in the U.S.) has a chance of being included, and that pollsters have a way to calculate that chance. Our samples are constructed in such a way that nearly every telephone in the U.S. — cell phones as well as landlines — has an equal chance of being included. This permits us to put a margin of likely error on our findings and to say how confident we are in the result.
But all of this great statistical theory would be for naught if we could not demonstrate that our polls are accurate. One of the toughest tests comes in elections: do the polls accurately predict the outcome? The answer is yes. In 2004, Pew Research’s final pre-election poll estimated that President Bush would get 51% of the vote and that John Kerry would get 48%, exactly the final margin. In 2008, our final estimate missed the actual result by only one percentage point. As proud as we are of our accuracy, many other national polls did well in both years. Indeed, the average for all national polls in both years came very close to the final margins.
Scott Keeter, Director of Survey Research, Pew Research Center
Q. Why has blogging decreased in frequency? Do you see this trend continuing?
We don’t know for sure, but there is some evidence in our most recent surveys that the activity formerly known as blogging is now being done on social networking sites as part of people’s wall-posting habits and messaging activities. So, it might be the case that personal journalism and even personal news-posting habits are simply switching to a new platform. This is something we are going to explore more in the future.
Lee Rainie, Director, Internet & American Life Project
Q. I’m hoping you can answer a question I have about the accuracy of current polling practices. I believe a high percentage of people now have phone systems that let them know who is calling before they answer the call. If others are like me and my friends, we simply don’t answer calls from strangers, including pollsters. This is a fairly recent development. Have you found an increased incidence of “non-response” and if so, how do you balance it in your samples?
You are certainly not alone in ducking our calls (but please consider picking up sometime – you might enjoy the interview). Survey non-response has been increasing steadily over the past two decades. Voice mail and caller ID have made it easier for people to avoid calls from unknown sources, but we also find that more people are refusing to be interviewed even when they do answer. This is true not only for telephone surveys but for personal interviews where the request is made face-to-face.
This trend has certainly added to the difficulty and cost of conducting high-quality survey research, but it is not the case that non-response necessarily causes polls to be less accurate. One yardstick for judging this is how polling does in forecasting the outcome of elections. If the kinds of people who refuse to take part in surveys are different from those who do participate, our polls will be biased. Yet, in the last several election cycles, most national telephone polls (including ours) have been very accurate. The National Council on Public Polls compiles the election forecasts of the major national polls, and in both 2004 and 2008, these estimates were very good predictors of the final vote.
One reason that polling can overcome the problem of low response rates is that most pollsters — including Pew Research — weight their data to ensure that the demographic composition of the samples conforms to the known national parameters for such characteristics as sex, age, race, education and region. Here is more detail on how we weight our data (and on our methods more generally).
Scott Keeter, Director of Survey Research, Pew Research Center
Q. Does anybody click on all those ads I see on the news and other sites I look at online?
Our recent survey, conducted together with the Project for Excellence in Journalism for their State of the News Media 2010 report, suggests that news consumers are not particularly eager or willing to click on ads. Our study finds that the great majority — 79% — of online news consumers say they have never or only rarely clicked on an online ad.
A section of the online chapter that talks about the rise of social media as a force in disseminating news and as a set of tools that allow people to participate in news is relevant in this regard. One implication of this is that media buyers and planners would be wise to consider social networking as a major pathway for people to learn about, discuss, and engage with news.
Lee Rainie, Director, Internet & American Life Project
Q. I wanted to know how can someone participate in the surveys that you conduct. I find them interesting, and would like to be a part of your studies.
While we appreciate people who want to participate, we can’t base our polls on volunteers. A survey of volunteers is a “non-probability sample” and the results cannot be generalized to the public as a whole. A key foundation of good survey research is to give every type of person an equal chance of having their views reflected (in more formal terms, our probability samples give everyone in the population of interest a known, non-zero chance of being selected). Polls of volunteers would violate this principle since not everyone would have had an equal chance of being included. And more specifically, the kinds of people who might volunteer for our polls are likely to be very different from the average American. Just like you, they are probably more politically knowledgeable and engaged.
Nonetheless, we get this question often and so we have created many opportunities for people to take our surveys and compare their responses to those of the general public. Among the most popular are our news knowledge quizzes, the political typology quiz, the technology user quiz, and our newest feature, How Millennial Are You? The Quiz.
For more on our sampling procedures, see the sampling section on our methodology webpage.
Scott Keeter, Director of Survey Research, Pew Research Center
March 25, 2010
Q: Do you ever take suggestions from the general public on the proper wording of questions? One question I have seen multiple times in your polls is along the lines of “How important is religion in your life?” (The exact wording may vary slightly from time to time.) Even though I am an atheist, and I never participate in any kind of religious ceremony or partake of the activities of religious organizations, the way the question is asked means I have to answer “Very important” if I am being honest. Religion is probably the MOST important negative in my life — I am constantly having to do battle over some issue where religion is the instigator and the main force for ill. Might I suggest that you re-work your question to separate out those who find religion “important” in a positive way from those who find it “important” in a negative way?
We are always open to input about our questions and have occasionally made changes in response to ideas and suggestions that come from outside the Pew Research Center. It’s certainly possible that there are other people like you who say that religion is important in their life but mean it in a negative way. But we think that’s likely to be a very small portion of all those who say religion is important. In the 2007 Religious Landscape Survey conducted by the Pew Forum on Religion & Public Life, 56% of all respondents answered that religion was very important in their lives. Yet among self-described atheists in the study, just 3% did so. This suggests to us that most people interpret this question the way we intend it to be interpreted.
Even if we have concerns about certain survey questions, we sometimes continue to use them because their trend over time is too valuable to lose. A good example can be found in the series of agree/disagree questions in our ongoing survey of political values. Survey methodologists have found that the agree/disagree format is susceptible to bias because certain types of people may be more likely than others to agree with a statement presented in this format than to the same statement presented in a more balanced format. But because we first began asking these questions in 1987, their value in tracking changes in opinion over time is very high; accordingly, we still periodically use these questions (though in 1994, we began a new series with many of the same concepts presented in a “balanced alternative” format).
The question about importance of religion has an even longer history than our values series (a version dates back to the mid-1960s), so we would be reluctant to change it unless we thought it was seriously misleading.
Scott Keeter, Director of Survey Research, Pew Research Center
Q. Do I have to state how old I am on my 2010 Census form or can I say “over 65”?
The 2010 Census form asks for everyone’s age and date of birth; the Census Bureau wants both because people sometimes give their ages incorrectly and the birth date offers a way to double-check the information. If a census form is incomplete, census-takers may try to phone or visit the household to obtain the additional information. If they cannot get the missing information that way, they may impute it — that is, apply statistical techniques to make a sophisticated guess based on characteristics of similar people.
Information given to the Census Bureau is confidential under federal law. Data are used only for statistical purposes, and any information about an individual is not allowed to be released for 72 years. Please note that the Census Bureau does not ask for information such as Social Security numbers, credit card numbers or personal financial information.
Why does the Census Bureau want to know how old you are? There are a number of federal programs that use data about different age groups to allocate funding or services. They include programs for children, women of child-bearing age, and older adults. According to a Census Bureau publication, “the Department of Education uses census age data in its formula for allotment to states. Under the Voting Rights Act, data on the voting-age population are required for legislative redistricting. The U.S. Department of Veterans Affairs uses age to develop its mandated state projections on the need for hospitals, nursing homes, cemeteries, domiciliary services, and other benefits for veterans.”
D’Vera Cohn, senior writer, Pew Social & Demographic Trends project
Q. How do search engines like Google affect the way people get their news and what changes are they forcing the news industry to consider as it tries to find a model for profitability and sustainability online?
As our studies have shown, the percentage of internet users who employ search engines has risen steadily over the last decade. Analysis of Nielsen Netratings data finds that lots of traffic to news sites is referred by search engines. The online news industry is in the middle of a huge debate about its relationship to search engines and aggregators. Should an organization allow Google to crawl and index their site or not? That’s a huge unsettled question in some segments of the industry. Several experiments now underway or soon to occur should provide answers as to whether search engines are revenue enhancers or revenue detractors from news sites. A second consideration is that the major search engines have for years provided email news alerts that alert people to new mentions of subjects that matter to them. My sense is that the “alert” process will become even more compelling and important as more and more people connect to the internet wirelessly. We already see that among “on the go” news consumers. You can find much more about the challenges to the news media spawned by the rise of the internet in the Pew Research Center’s Project for Excellence in Journalism’s “State of the News Media 2010” report and the joint Pew Internet Project/PEJ report “Understanding the Participatory News Consumer“.
Lee Rainie, Director, Pew Internet & American Life Project
Q. The Census Bureau has been making a lot of effort to get people to fill out their census forms. How do they know how well they are doing in persuading people to mail back the forms they receive?
For the 2010 Census, the Census Bureau will use a new real-time metric, called the “mail participation rate,” to report the share of U.S. households — by state, city, county and neighborhood — that send back their completed forms. As part of its promotional campaign to encourage rapid responses, the Census Bureau plans to release mail participation rates down to the neighborhood level each weekday, from March 22 to April 26. Knowing where the problems are could help the bureau and its partner organizations — such as local governments and community groups — steer their census-encouragement efforts to the areas that could benefit most. The 2010 mail participation rates will be displayed daily on a recently launched Census Bureau mapping tool.
The Census Bureau also tracked response in earlier census counts, but bureau officials say the measure they used in previous decades would not paint a true picture in areas with large numbers of empty homes. The mail participation rate is intended to exclude vacant and foreclosed homes, which have grown in number as a result of the national economic downturn. It may also provide an improved real-time measure of participation for areas with large numbers of seasonal homes that are unoccupied on Census Day, April 1.
Find out more about why the Census Bureau is so anxious to speed up its count and the various ways it will measure its success. And explore other aspects of this massive undertaking at our All Things Census page.
D’Vera Cohn, senior writer, Pew Social & Demographic Trends project
Q. What does “PEW” stand for?
Pew is a family name, not an acronym. The four children of Joseph Newton Pew, who founded the Sun Oil company, created and funded The Pew Charitable Trusts in the late 1940s. The Pew Charitable Trusts is a large public charity with headquarters in both Philadelphia and Washington. Members of the Pew family, primarily from the fourth generation, continue to comprise half of its board. The Pew Research Center is a subsidiary of The Pew Charitable Trusts and receives nearly all its funding from the parent organization.
Donald Kimelman, Managing Director, Information Initiatives and the Philadelphia Program, The Pew Charitable Trusts
Q. I am always frustrated by polls asking whether one is a liberal, moderate, or conservative. My feeling is that about two-thirds of Americans are liberal on social issues and conservative on economic issues. (In other words they are actually Libertarians.) Can’t you ask this question better? Even laying out “litmus test” questions on gun control, abortion, the effect of more or less taxes and deficits, gay marriage, national defense (foreign adventures), space exploration, size of government, global warming (and what to do about it, assuming it exists), etc. I fear that many people answer “moderate” because they are taking an average, so to speak, while having very strong but inconsistent and diverging opinions — anything but moderate.
As you note, the standard ideology question assumes that most people are arrayed along a single left-right political dimension. For the reasons you point out, that doesn’t work for everyone. Unfortunately there is no simple solution to the problem, because we don’t have the luxury of asking a series of questions on every poll that could be used to classify people more precisely.
However, in a 2006 analysis we attempted to map our survey respondents onto a two-dimensional space with economic issues on one dimension and social issues on the other. Although the selection of questions we had to work with was not ideal, we found that the simple left-right continuum did not work for many people (about one-quarter of the public); 16% of Americans were economically liberal but socially conservative (sometimes called “populists”), while 9% were economically conservative and socially liberal (or “libertarian,” as you describe them). In addition, the analysis showed that about one-in-five people (18%) were “liberal” in both their social and economic views, while 15% were “conservative” on both dimensions. The plurality of respondents (42%) were “ambivalent,” offering a mixture of ideological views or expressing no opinion on several of the items we asked about. Read the report here.
A more extensive effort of this sort is our “political typology” project, conducted periodically (and most recently in late 2004). You can take the test and identify your typology group here and read the full report here.
Scott Keeter, Director of Survey Research, Pew Research Center and Gregory Smith, Senior Researcher, Pew Forum on Religion & Public Life
Q. I — and most of my friends — only have a cell phone … and no landline. Are we represented in your polls? If so, how? There is no cell phone directory, is there?
Yes, indeed, you are represented in our polls. We routinely call cell phones — and we hope you will take our call if it comes! There are many cell-only people like you. According to Pew Research Center estimates based on government data, nearly one-quarter of adults in the U.S. (24%) now live in households with only a cell phone and no landline … about twice as many as live in households with a landline but no cell phone. Because the cell-only are very different from people who can be reached by landline (e.g., much younger, more likely to be renting, more likely to be black or Hispanic), it’s important to make sure they are represented in our polls. Nearly all Pew Research surveys now routinely include cell phones in their samples. At the Pew Research Center for the People & the Press, we attempt to interview approximately one-third of the respondents for each survey on a cell phone (not all of these people are cell-only, but many of them are).
You are correct that there is no cell phone directory. But databases maintained by the telecommunications industry allow us to identify the specific prefixes and 1000-blocks of numbers to which most cell phone numbers are assigned (these are usually separate from the prefixes and blocks assigned to landline phones). From these known blocks of numbers, we can randomly generate complete telephone numbers that have a high likelihood of being working cell phone numbers. Federal law prohibits using an automatic dialing system to call these numbers, so our interviewers manually dial them. To help compensate cell phone owners for the possibility that they are paying for the call by using up their minutes, we offer to send them a small financial reimbursement.
You can find more details about our telephone survey methods in a special section at pewresearch.org/pewresearch-org/politics.
Scott Keeter, Director of Survey Research, Pew Research Center
Q. The first question in your Political News IQ quiz asks which of four percentages is closest to the current national unemployment rate. According to you the correct answer is 10%. But isn’t the real unemployment rate much higher?
The 10% rate refers to the official government unemployment rate reported monthly by the U.S. Bureau of Labor Statistics and most frequently cited by the media. It is derived from the Current Population Survey conducted each month among some 60,000 households comprising of about 110,000 people. In January 2010 (when the Pew Research News IQ survey was taken) and in February 2010 the official rate was 9.7%. In determining that measure, the BLS counts as unemployed all persons who reported that they were currently without work but wanted a job and were either on temporary layoff or had actively looked for work in the preceding four weeks. The BLS definition of active job seeking includes — but is not limited to — contacting employers or employment agencies, asking friends or relatives, sending out resumes, answering or placing ads.
Critics object that this measure, which has been subject to only minor refinements since it was adopted in 1940, excludes “discouraged workers,” that is, people who would like to have a job but gave up looking in despair. Nor does it include people who have part-time jobs because that is all they could find but who would rather have full-time work. Although these criticisms have been made for many decades, they have gained added strength in recent months because other data — also collected by BLS — indicate that the number of people in these excluded categories of potential workers has continued to increase even as the official unemployment rate has leveled off.
In fact, beginning in the 1970s, the BLS has computed and published monthly, a range of unemployment indicators. As last modified, these are known as U-1 through U-6 with U-3 corresponding to the official unemployment rate. The most comprehensive of these (U-6) attempts to measure both the underemployed and discouraged workers. The BLS observes that for most of the period since 1994 all of these measures — despite the more subjective factors they rely on — have very closely tracked the official rate, which, given its long history, remains the most objective and reliable indicator of labor underutilization. (For more on the unemployment rate see “How the Government Measures Unemployment“)
Jodie T. Allen, Senior Editor, Pew Research Center
Q. How does the Pew Internet & American Life Project choose the topics that it researches?
From the first days of our project in early 2000, there have been two broad thrusts to our research. The first is that we want to monitor who uses the internet and the activities they pursue online. The second is that we want to focus on the internet’s impact in a handful of special areas of social importance: the family, communities, health care, education (both in formal and informal settings), civic and political life, and the workplace.
As it turns out, those broad goals have led to multiple kinds of outcomes and research products. We have counted who is online starting with our first survey in March 2000 and regularly update those findings. Those who want to see how the internet population has shifted since 2000 and how access has changed among key demographic groups can download a big spreadsheet with all that historic and up-to-date data by going to this page and then clicking on the link labeled “Usage over time” (near the bottom of the page).
The original question about access has expanded and we have been regularly reporting on broadband, mobile connectivity and cloud computing. At the same time, we have added dozens of new activities to our list to stay current with the most important and popular activities. We measure them in two ways: First, we ask people if they have “ever” done an online activity such as “use email” or “bank online” or “use a social networking site” and we report our latest figures here. Second, we ask people if “yesterday” they performed any of these online activities and we report those findings here. And, again, all our historic data about online activities is part of the big spreadsheet that covers “Usage over time.”
When it comes to our research on the major social impacts of the internet, we have broken out a variety of key areas all of which can be found on our “Topics” pages.
We also try to tackle major policy and social questions in our work on such things as privacy and identity, digital divides, copyright issues, the news environment, e-government, and the like can be found through our topics page or using the search box on the top right of all our website’s pages.
Along with sending questions to info@pewresearch.org, if you have an ideas for subjects the Pew Internet & American Life Project should research or things we should add to our list of online activities, please let us know by writing to webmaster@pewresearch.org/pewresearch-org/internet.
Lee Rainie, Director, Pew Internet & American Life Project
