On the face of it, these should be heady times for American workers. U.S. unemployment is as low as it’s been in nearly two decades (3.9% as of July) and the nation’s private-sector employers have been adding jobs for 101 straight months – 19.5 million since the Great Recession-related cuts finally abated in early 2010, and 1.5 million just since the beginning of the year.
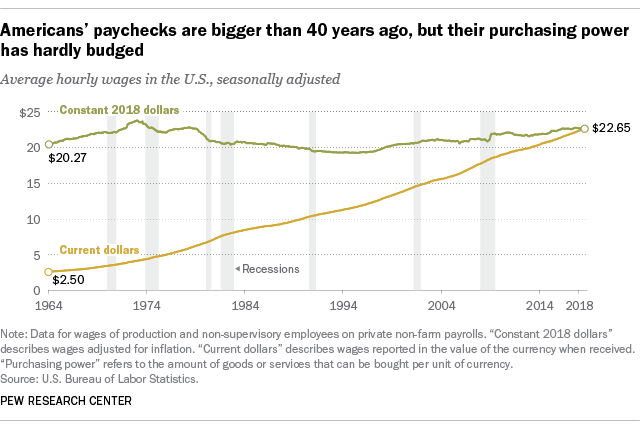
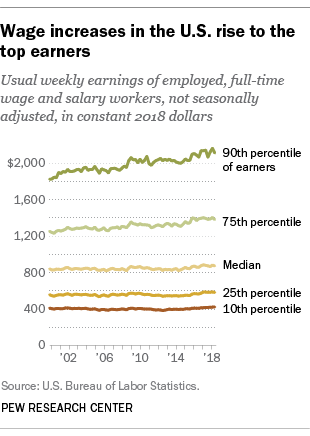
But despite the strong labor market, wage growth has lagged economists’ expectations. In fact, despite some ups and downs over the past several decades, today’s real average wage (that is, the wage after accounting for inflation) has about the same purchasing power it did 40 years ago. And what wage gains there have been have mostly flowed to the highest-paid tier of workers.

The disconnect between the job market and workers’ paychecks has fueled much of the recent activism in states and cities around raising minimum wages, and it also has become a factor in at least some of this year’s congressional campaigns.
Average hourly earnings for non-management private-sector workers in July were $22.65, up 3 cents from June and 2.7% above the average wage from a year earlier, according to data from the federal Bureau of Labor Statistics. That’s in line with average wage growth over the past five years: Year-over-year growth has mostly ranged between 2% and 3% since the beginning of 2013. But in the years just before the 2007-08 financial collapse, average hourly earnings often increased by around 4% year-over-year. And during the high-inflation years of the 1970s and early 1980s, average wages commonly jumped 7%, 8% or even 9% year-over-year.
After adjusting for inflation, however, today’s average hourly wage has just about the same purchasing power it did in 1978, following a long slide in the 1980s and early 1990s and bumpy, inconsistent growth since then. In fact, in real terms average hourly earnings peaked more than 45 years ago: The $4.03-an-hour rate recorded in January 1973 had the same purchasing power that $23.68 would today.
A similar measure – the “usual weekly earnings” of employed, full-time wage and salary workers – tells much the same story, albeit over a shorter time period. In seasonally adjusted current dollars, median usual weekly earnings rose from $232 in the first quarter of 1979 (when the data series began) to $879 in the second quarter of this year, which might sound like a lot. But in real, inflation-adjusted terms, the median has barely budged over that period: That $232 in 1979 had the same purchasing power as $840 in today’s dollars.

Meanwhile, wage gains have gone largely to the highest earners. Since 2000, usual weekly wages have risen 3% (in real terms) among workers in the lowest tenth of the earnings distribution and 4.3% among the lowest quarter. But among people in the top tenth of the distribution, real wages have risen a cumulative 15.7%, to $2,112 a week – nearly five times the usual weekly earnings of the bottom tenth ($426).
Cash money isn’t the only way workers are compensated, of course – health insurance, retirement-account contributions, tuition reimbursement, transit subsidies and other benefits all can be part of the package. But wages and salaries are the biggest (about 70%, according to the Bureau of Labor Statistics) and most visible component of employee compensation.

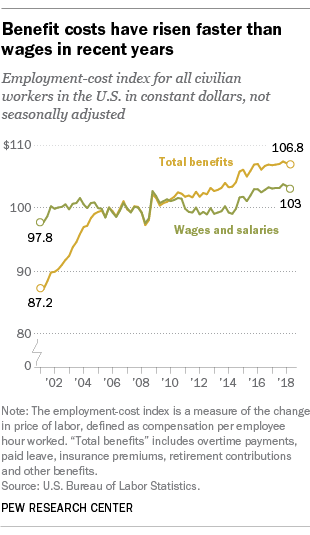
Wage stagnation has been a subject of much economic analysis and commentary, though perhaps predictably there’s little agreement about what’s causing it (or, indeed, whether the BLS data adequately capture what’s going on). One theory is that rising benefit costs – particularly employer-provided health insurance – may be constraining employers’ ability or willingness to raise cash wages. According to BLS-generated compensation cost indices, total benefit costs for all civilian workers have risen an inflation-adjusted 22.5% since 2001 (when the data series began), versus 5.3% for wage and salary costs.
Other factors that have been suggested include the continuing decline of labor unions; lagging educational attainment relative to other countries; noncompete clauses and other restrictions on job-switching; a large pool of potential workers who are outside the formally defined labor force, neither employed nor seeking work; and broad employment declines in manufacturing and production sectors and a consequent shift toward job growth in low-wage industries.
Sluggish and uneven wage growth has been cited as a key factor behind widening income inequality in the United States. A recent Pew Research Center report, based on an analysis of household income data from the Census Bureau, found that in 2016 Americans in the top tenth of the income distribution earned 8.7 times as much as Americans in the bottom tenth ($109,578 versus $12,523). In 1970, when the analysis period began, the top tenth earned 6.9 times as much as the bottom tenth ($63,512 versus $9,212).
Note: This is an update to a post originally published Oct. 9, 2014.
