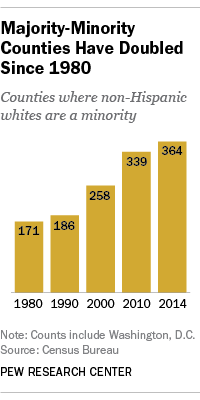
Last week’s Census Bureau release of 2014 population estimates confirms that the U.S. is becoming ever more diverse, at the local level as well as nationally. As of last summer, according to a Fact Tank analysis, 364 counties, independent cities and other county-level equivalents (11.6% of the total) did not have non-Hispanic white majorities – the most in modern history, and more than twice the level in 1980.
That year – the first decennial enumeration in which the nation’s Hispanic population was comprehensively counted – non-Hispanic whites were majorities in all but 171 out of 3,141 counties (5.4%), according to our analysis. The 1990 census was the first to break out non-Hispanic whites as a separate category; that year, they made up the majority in all but 186 counties, or 5.9% of the total. (The Census Bureau considers Hispanic to be an ethnicity rather than a race; accordingly, Hispanics can be of any race.)
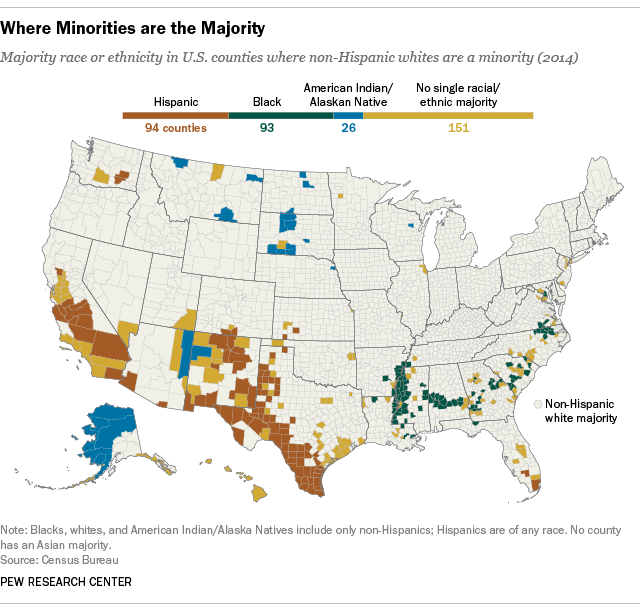
Since then, the nation’s Hispanic population has more than doubled, from 22.4 million to 55.4 million, powering the increase in majority-minority counties. Last year, 94 counties had Hispanic majorities – just over twice the number of majority-Hispanic counties in 1990 (45), and one more than the number of counties last year with non-Hispanic black majorities.
Another telling indicator of greater diversity: In 1990, there were only 29 counties where no single racial or ethnic group made up a majority of the population. Last year, 151 counties had no racial or ethnic majority.
While the single biggest Hispanic-majority county is in Florida (Miami-Dade, 66% of whose 2.7 million people are Hispanic), most are concentrated in the Southwest: 60 are in Texas, 12 are in New Mexico and 11 are in California. All but two of the 93 black-majority counties are in states of the old Confederacy (with 25 in Mississippi, 17 in Georgia and 11 in Alabama). In 26 counties, Native Americans or Alaska Natives (who are combined into one group for census purposes) comprise the majority; aside from eight lightly populated boroughs and census areas in Alaska, most of the other counties overlap with reservations in the Southwest and Great Plains.
All in all, non-Hispanic whites are less than a majority in four states – California, Texas, New Mexico and Hawaii – as well as the District of Columbia. In fact, in none of those places does a single racial or ethnic group have a majority: California has almost equal shares of Hispanics (38.6%) and non-Hispanic whites (38.5%); non-Hispanic whites are the plurality in Texas (43.5%); Hispanics in New Mexico (47.7%); blacks in D.C. (47.4%); and Asians in Hawaii (36.4%).
