
The nation’s aggregate wealth continued to show signs of recovery, ascending to $81.5 trillion as of June 30, after bottoming out at $55 trillion in 2009, according to a new Federal Reserve report released Thursday.
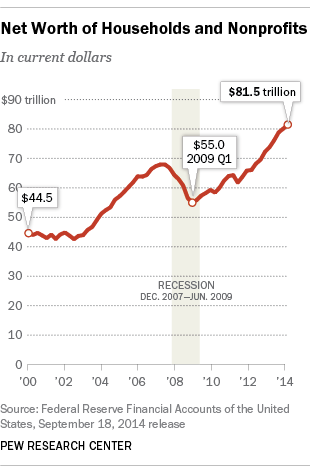
The Fed’s aggregate wealth figures, which measure the total net worth of all U.S. households and nonprofits, suggest that inflation-adjusted wealth per household has significantly increased since 2009 (roughly growing 29%) and has surpassed its pre-Recession peak. (The chart to the right does not show these figures adjusted for inflation or number of households.)
But as other economic reports and indicators suggest, that wealth recovery has been concentrated on the wealthiest Americans. Although there is some evidence that those at the bottom are also seeing an economic lift, the aggregate net worth for America’s economic middle is actually declining. In August, the Census Bureau released detailed wealth tabulations that imply that the minimum wealth level needed to qualify for the wealthiest 1% of American households increased from $2.3 million in 2009 to $2.4 million in 2011. That in itself indicates there were wealth gains at the very top of the wealth distribution. On the other hand, the minimum wealth level needed to be in the wealthiest 4% of households fell from 2009 to 2011, from which one infers that wealth declined for households at the wealthiest 4% level.
The Census figures also indicate that there were small gains in wealth among the nation’s least wealthy households—the bottom 30% (in 2011 households with a net worth of $7,500 or less). But for the broad middle up to the most wealthy 4% of American households, wealth declined from 2009 to 2011.
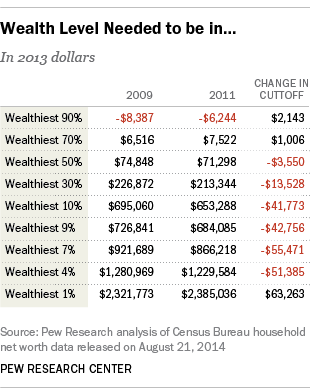
Similarly, earlier this month the Federal Reserve reported that the minimum wealth needed to qualify for the wealthiest 5% of American households fell from 2010 to 2013. The decline in the cutoff indicates that wealth gains occurred only among households wealthier than the most wealthy 5%.
The growth in the nation’s wealth from $55 trillion in 2009 to $81 trillion in 2014 tracks closely with the direction of change of other economic indicators since 2009.
For many American households most of their wealth is tied up in their homes. Nationally, the Case-Shiller home price index is up 13% from March 2009. The S&P 500 stock market index recently closed above 2000, up from its low of 677 in March 2009.
So the deluge of wealth figures over the past month indicate that America’s household wealth pie is growing due to rising values for stocks and homes. But, the first few years of the wealth recovery have been very uneven.
