National Hispanic Heritage Month, which begins in the United States each year on Sept. 15, celebrates U.S. Latinos, their culture and their history. Started in 1968 by Congress as Hispanic Heritage Week, it was expanded to a month in 1988. The celebration begins in the middle of September to coincide with independence days in several Latin American countries: Guatemala, Honduras, El Salvador, Nicaragua and Costa Rica celebrate theirs on Sept. 15, followed by Mexico on Sept. 16, Chile on Sept. 18 and Belize on Sept. 21.
Here are some key facts about the U.S. Latino population by geography and by characteristics such as language use and origin group.
As part of our ongoing research about Hispanics in the United States, we analyzed how this group has changed over time using data from the U.S. Census Bureau. The decennial census (PL94-171 census data) provided some historical state and national population counts, and population estimates provided the latest data on total population, births and immigration.
We also examined characteristics of the U.S. Hispanic population using the American Community Survey (ACS), which provides data for states and the U.S. on Hispanic origin, language use, country of birth and educational attainment. Data from the 2022 ACS and some from the 2010 ACS are from tabulations released by U.S. Census Bureau. Some ACS and census data is from Integrated Public Use Microdata Series (IPUMS) of the University of Minnesota.
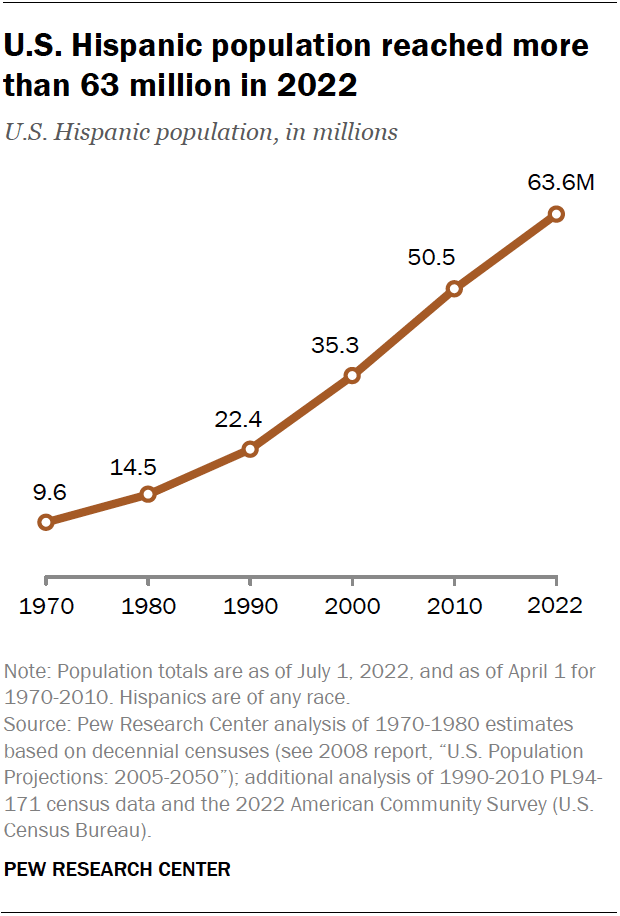
The U.S. Hispanic population reached 63.6 million in 2022, up from 50.5 million in 2010. The 26% increase in the Hispanic population was faster than the nation’s 8% growth rate but slower than the 34% increase in the Asian population. In 2022, Hispanics made up nearly one-in-five people in the U.S. (19%), up from 16% in 2010 and just 5% in 1970.
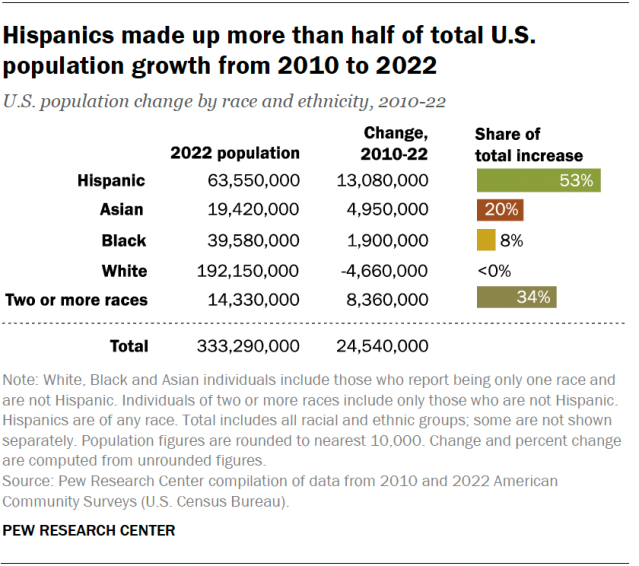
Hispanics have played a major role in U.S. population growth over the past decade. The U.S. population grew by 24.5 million from 2010 to 2022, and Hispanics accounted for 53% of this increase – a greater share than any other racial or ethnic group. The next closest group is non-Hispanic people who identify with two or more races. Their population grew by 8.4 million during this time, accounting for 34% of the overall increase.
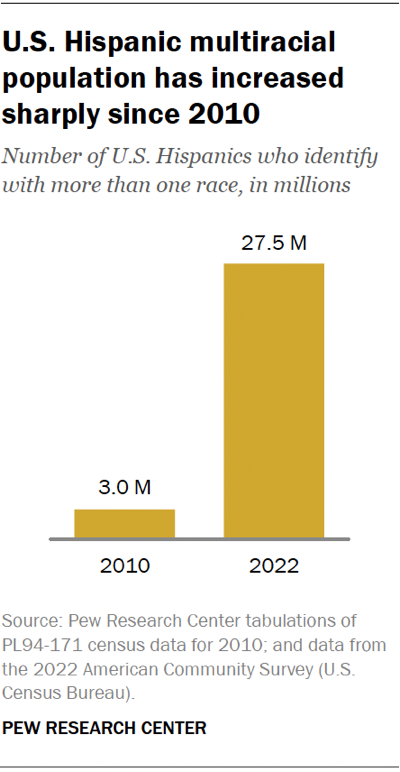
The number of Latinos who say they are multiracial has increased dramatically. More than 27 million Latinos identified with more than one race in 2022, up from 3 million in 2010. The increase could be due to several factors, including changes to the census form that make it easier for people to select multiple races and growing racial diversity.
Growth in the number of multiracial Latinos comes primarily from those who identify as at least one specific race and “some other race” (i.e., those who write in a response). This population grew from 2.1 million to 24.9 million between 2010 and 2022 and now represents about 91% of multiracial Latinos. The increase was due almost entirely to growth in the number of people who identified as White and some other race, according to the 2020 census.
At the same time, the number of Latinos who identified as White and no other race declined from 26.7 million in 2010 to 10.7 million in 2022.
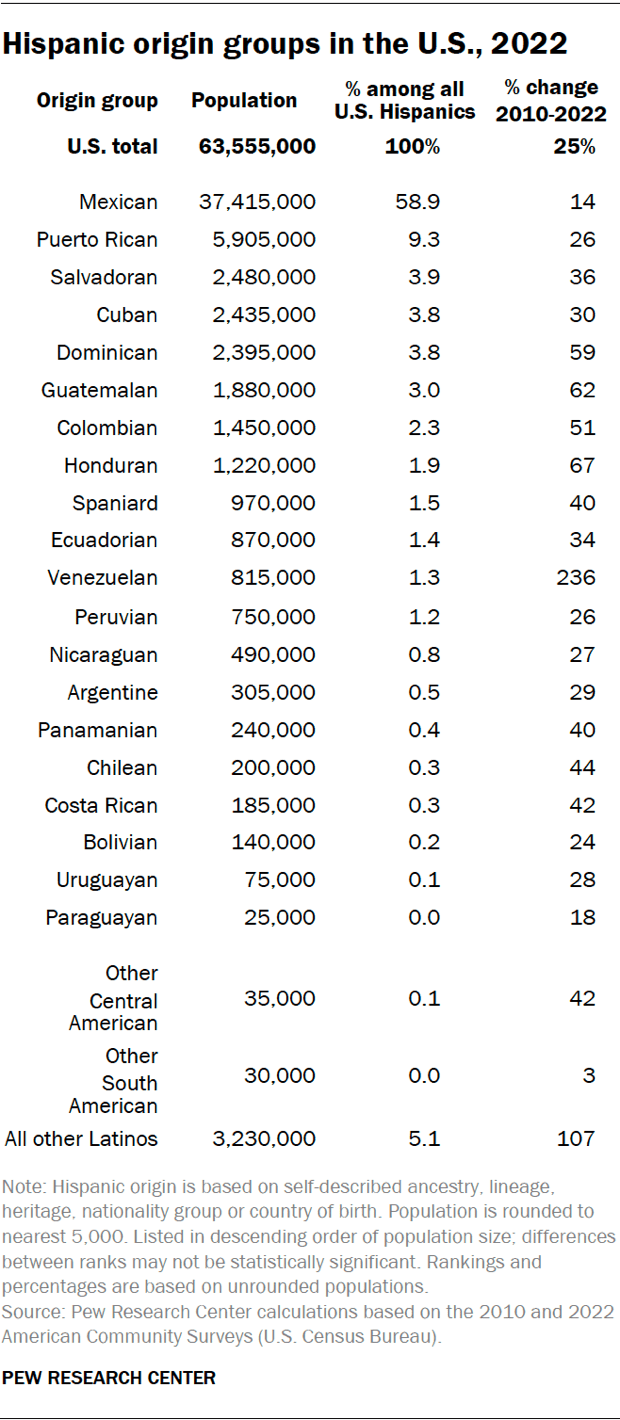
The roughly 37.4 million people of Mexican origin in the U.S. represented nearly 60% of the nation’s Hispanic population in 2022. Those of Puerto Rican origin are the next largest group, at 5.9 million, which does not include another roughly 3.2 million Puerto Ricans who lived on the island in 2022. The U.S. population of Puerto Rican origin has grown partly due to people moving from Puerto Rico to the 50 states and the District of Columbia.
Six other Hispanic origin groups in the U.S. each have 1 million or more people: Salvadorans, Cubans, Dominicans, Guatemalans, Colombians and Hondurans. In addition, in 2022, Spaniards accounted for nearly 1 million U.S. Latinos.
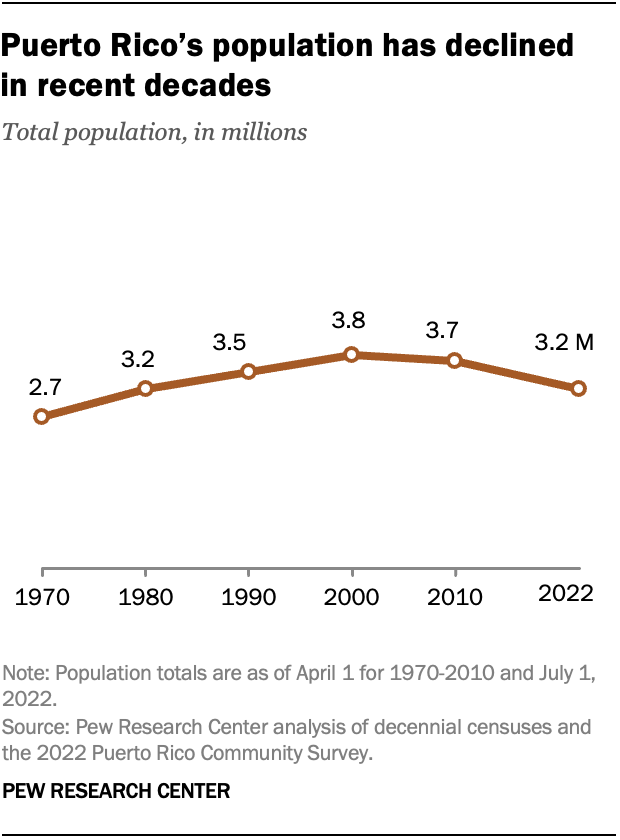
Puerto Rico’s population has declined by about 500,000 since 2010, from 3.7 million to 3.2 million. Puerto Rico has experienced a net population loss since at least 2005, driven by low fertility rates and migration to the U.S. mainland. An ongoing economic recession and devastation from hurricanes Maria and Irma in 2017 have also contributed to the decline.
Venezuelans have seen the fastest population growth among U.S. Latinos. From 2010 to 2022, the Venezuelan-origin population in the U.S. increased by 236% to 815,000. Four other groups saw growth rates exceeding 50%: Hondurans increased by 67%, followed by Guatemalans (62%), Dominicans (59%) and Colombians (51%).
By contrast, the number of people of Mexican origin in the U.S. grew by only 14%, by far the slowest rate among the most populous origin groups.
Hispanics are the largest racial or ethnic group in California and Texas. This demographic milestone in California happened in 2014 and was a first for the state with the nation’s largest Hispanic population. Latinos accounted for 40% of California’s population in 2022, among the greatest shares in the country.
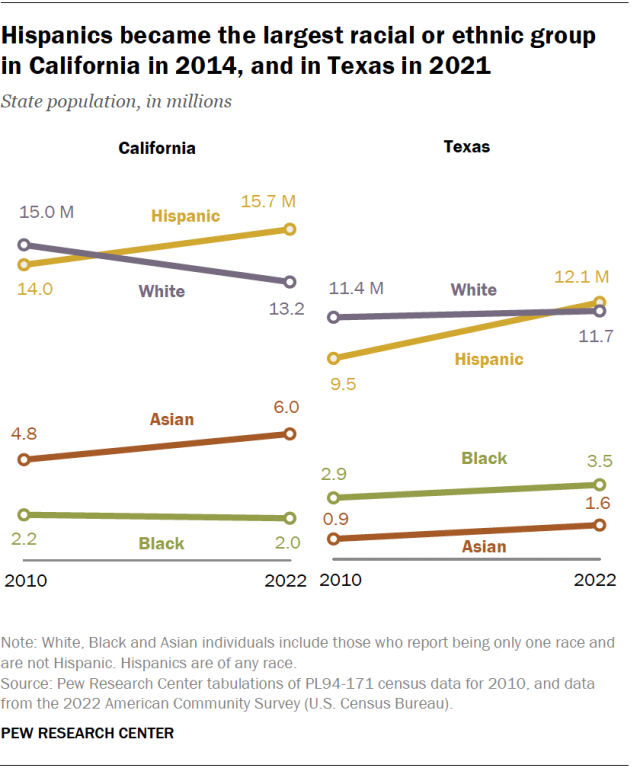
That year, there were about 15.7 million Hispanics in California, up from 14.0 million in 2010. The non-Hispanic White population, the next largest group, declined from 15.0 million to 13.2 million during this time, reflecting a broader national trend.
In Texas, the state with the next largest Latino population (12.1 million), Latinos also made up 40% of the population in 2022 and became the largest racial or ethnic group in 2021. In Florida, the state with the third-largest Latino population (6.0 million), Latinos made up 27% of residents.
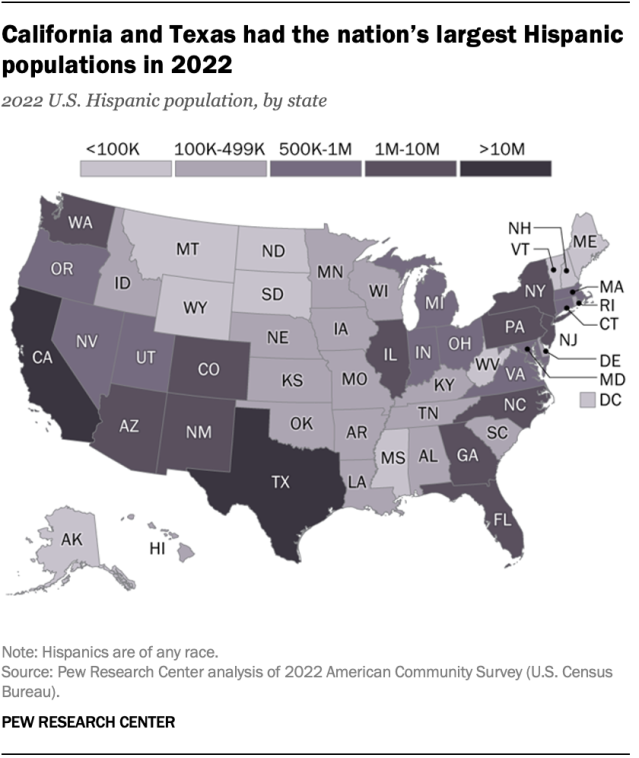
Rounding out the top five states with the largest Hispanic populations were New York (3.9 million) and Arizona (2.4 million). Eight more states had 1 million or more Hispanics: Illinois, New Jersey, Colorado, Georgia, Pennsylvania, North Carolina, Washington and New Mexico.
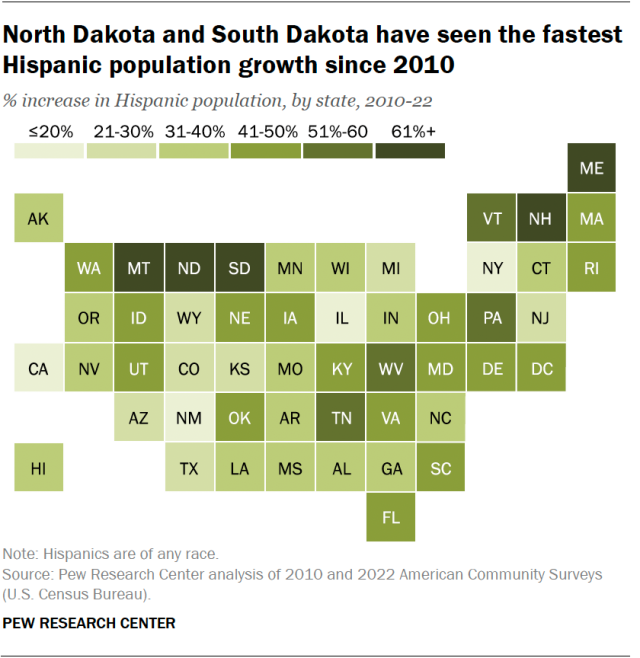
Vermont had the nation’s smallest Latino population (15,000) in 2022, followed by Maine (29,000), West Virginia and North Dakota (34,000 each), and South Dakota (42,000).
In New Mexico, Hispanics have been a majority of the population since 2021 and the state’s largest racial or ethnic group since the early 2000s. In 2022, the state was home to 1.1 million Hispanics.
Three states’ Hispanic populations increased by more than 1 million from 2010 to 2022. Texas (2.5 million increase), Florida (1.8 million) and California (1.6 million) accounted for almost half of the growth nationwide since 2010. Arizona (480,000 increase), New Jersey (464,000) and New York (432,000) had the next-biggest increases. All 50 states and the District of Columbia have seen growth in their Hispanic populations since 2010.
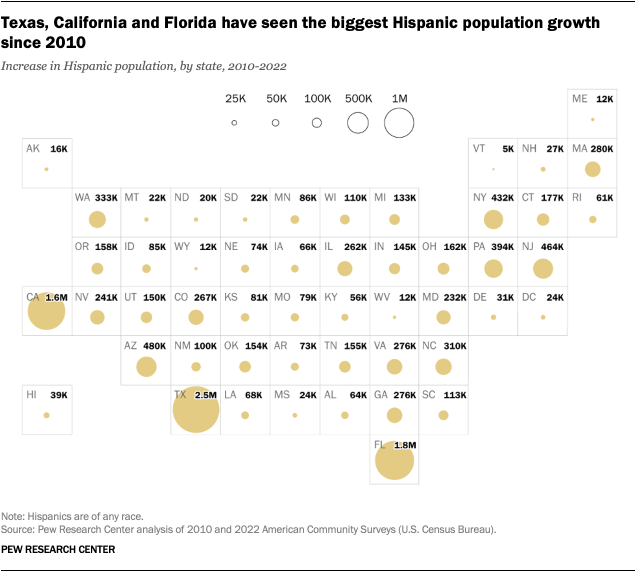
North and South Dakota’s Hispanic populations have grown the fastest since 2010. The number of Hispanics in North and South Dakota more than doubled (146% and 107% increases, respectively) from 2010 to 2022. But even with that growth, these states each had fewer than 45,000 Hispanics in 2022, among the smallest populations in the country.
The slowest growth was in New Mexico (10% increase), California (12%), and Illinois and New York (13% each), all states with significant Hispanic populations.
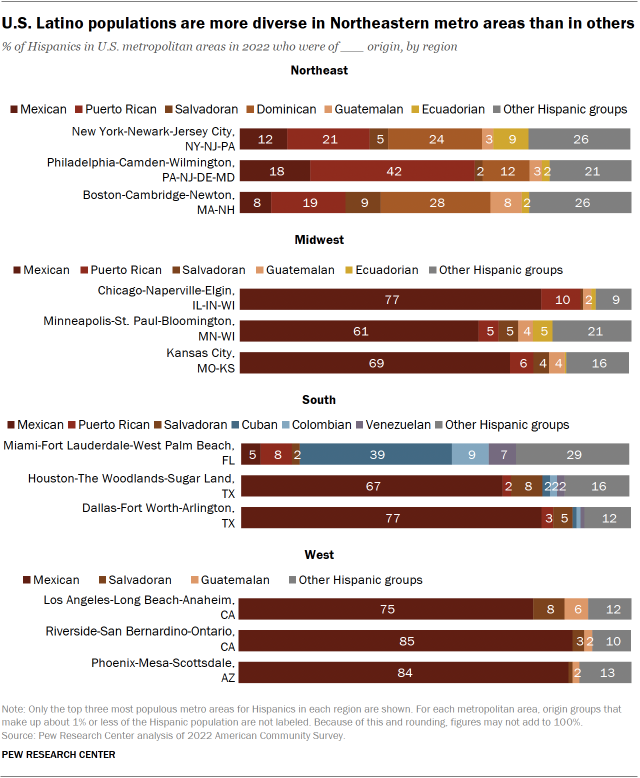
The makeup of the U.S. Hispanic population varies widely across major metropolitan areas. Most of the metro areas in the Midwest, West and South with the largest Hispanic populations are predominantly Mexican. About three-quarters of Hispanics in the Chicago (77%) and Los Angeles (75%) areas identify as Mexican, as do 67% in the Houston area.
Metro areas in the Northeast tend to have more diverse Hispanic origins. For example, no origin group makes up more than 30% of the New York and Boston metro areas’ Hispanic populations.
Metro areas in Florida and the nation’s capital have distinctive Hispanic enclaves. Puerto Ricans make up 43% of Hispanics in the Orlando area, while Cubans make up 39% of Hispanics in the Miami area. In the Washington, D.C., metro area, Salvadorans account for 30% of Hispanics.
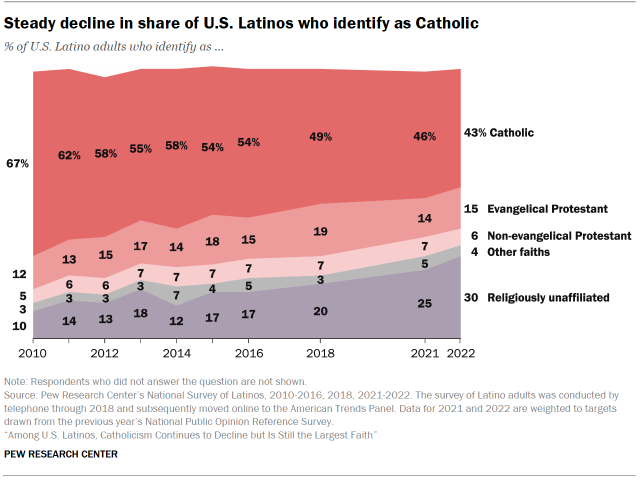
Catholics remain the largest religious group among Latinos in the U.S., but they have become a smaller share of the Latino population over the past decade. In 2022, 43% of Latinos adults identify as Catholic, down from 67% in 2010. Meanwhile, 30% of Latinos are religiously unaffiliated (describing themselves as atheist, agnostic or “nothing in particular”), up from 10% in 2010. The share of Latinos who identify as Protestants – including evangelical Protestants – has been relatively stable.
Newborns, not immigrants, have driven the recent growth among U.S. Hispanics. During the 2010s, an average of 1 million Hispanic babies were born each year, slightly more than during the 2000s. At the same time, about 350,000 Hispanic immigrants arrived annually, down substantially from the previous two decades.
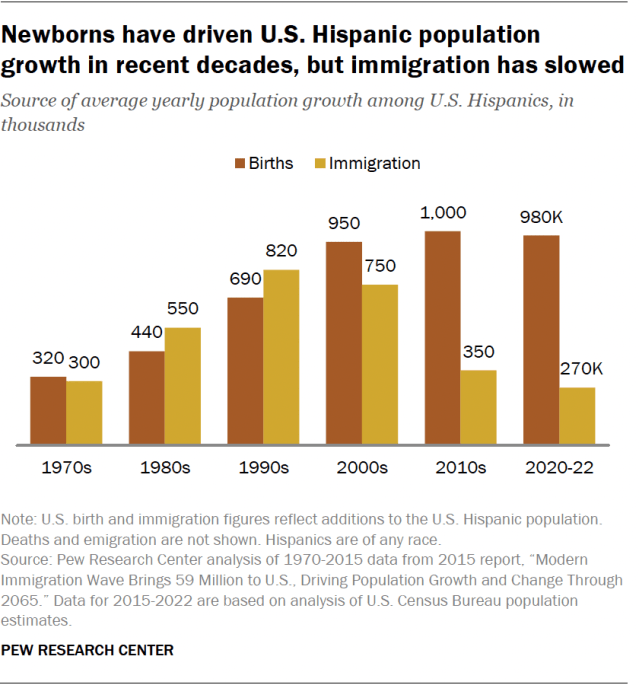
The recent predominance of new births over immigration as a source of Hispanic population growth is a reversal of historical trends. In the 1980s and 1990s, immigration drove Hispanic population growth.
From 2020 to 2022, average annual births among Hispanics were slightly below the previous decade, but immigration decreased considerably, from 350,000 per year to 270,000. Some of this decline can be attributed to immigration into the U.S. stopping almost entirely during the early stages of the COVID-19 pandemic. With the removal of pandemic-related restrictions, the contribution of immigration to Hispanic growth appears to be returning to early 2010s levels.
The share of Latinos in the U.S. who speak English proficiently is growing. In 2022, 72% of Latinos ages 5 and older spoke English proficiently, up from 59% in 2000. U.S.-born Latinos are driving this growth: The share of U.S.-born Latinos who speak English proficiently increased by 9 percentage points in that span, compared with a 5-point increase among Latino immigrants. All told, 42.3 million Latinos in the U.S. spoke English proficiently in 2022.
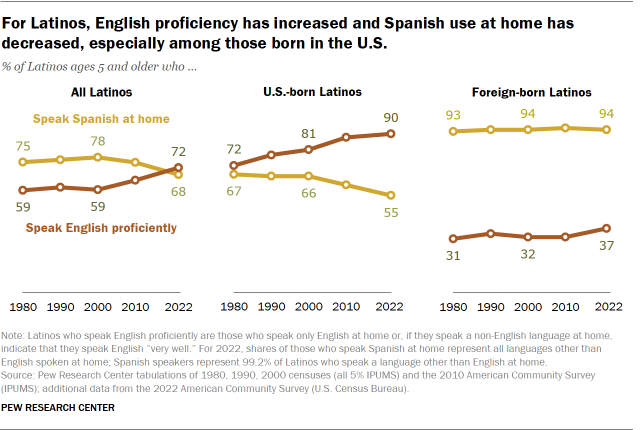
At the same time, the share of Latinos who speak Spanish at home declined from 78% in 2000 to 68% in 2022, and most of that decline was among the U.S. born.
Even though the share of Latinos who speak Spanish at home has declined, the number who do so has grown from 24.6 million in 2000 to 39.7 million in 2022 because of the overall growth in the Latino population.
The share of U.S. Hispanics with college experience has increased since 2010. About 45% of U.S. Hispanic adults ages 25 and older had at least some college experience in 2022, up from 36% in 2010. The share of Hispanics with a bachelor’s degree or more education also increased, from 13% to 20%. The share with a bachelor’s degree or higher increased more among Hispanic women (from 14% to 22%) than Hispanic men (12% to 18%).
The number of Latinos enrolled in college or postgraduate education also increased between 2010 and 2022, from 2.9 million to 4.2 million. Among all U.S. undergraduate and graduate students, the share of Latinos increased from 14% in 2010 to 20% in 2022, slightly higher than the Latino share of the total population.
Four-in-five Latinos are U.S. citizens. As of 2022, 81% of Latinos living in the country are U.S. citizens, up from 74% in 2010. This includes people born in the U.S. and its territories (including Puerto Rico), people born abroad to American parents, and immigrants who have become naturalized citizens. The Center recently published citizenship rates among Hispanic origin groups for 2021; this data is not yet available for 2022.
Note: This post has been regularly updated since it was originally published on Sept. 16, 2014.


