
Note: For more recent data on this topic, see this post.
https://www.youtube.com/watch?v=NoTzjxUfh1Q Issues of inequality seem poised to play a large role in the public discourse this year. President Obama is expected to use his Jan. 28 State of the Union speech to promote specific proposals aimed at inequality, such as raising the federal minimum wage. Congressional Democrats reportedly see inequality as an issue that could help them in this year’s midterm elections. And some Republicans, such as Sen. Marco Rubio of Florida, have begun talking about creating “a new opportunity society in America” as a conservative approach to addressing persistent poverty.
As the debate gears up, it’s important to understand some basic facts about how inequality is measured, the trends over time and how the U.S. compares globally. Here’s a “5 Facts” primer:
By one measure, U.S. income inequality is the highest it’s been since 1928. In 1982, the highest-earning 1% of families received 10.8% of all pretax income, while the bottom 90% received 64.7%, according to research by UC-Berkeley professor Emmanuel Saez. Three decades later, according to Saez’ preliminary estimates for 2012, the top 1% received 22.5% of pretax income, while the bottom 90%’s share had fallen to 49.6%.

The U.S. is more unequal than most of its developed-world peers. According to data from the Organization for Economic Cooperation and Development, the U.S. ranked 10th out of 31 OECD countries in income inequality based on “market incomes” — that is, before taking into account the redistributive effects of tax policies and income-transfer programs such as Social Security and unemployment insurance. After accounting for taxes and transfers, the U.S. had the second-highest level of inequality, after Chile.
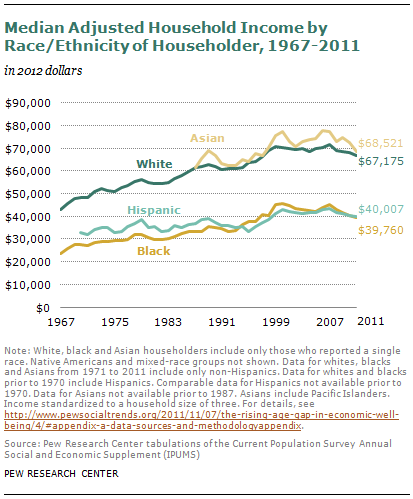
The black-white income gap in the U.S. has persisted. The difference in median household incomes between whites and blacks has grown from about $19,000 in 1967 to roughly $27,000 in 2011 (as measured in 2012 dollars). Median black household income was 59% of median white household income in 2011, up modestly from 55% in 1967; as recently as 2007, black income was 63% of white income.
Americans are relatively unconcerned about the wide income gap between rich and poor. Americans in the upper fifth of the income distribution earn 16.7 times as much as those in the lowest fifth — by far the widest such gap among the 10 advanced countries in the Pew Research Center’s 2013 global attitudes survey. Yet barely half (47%) of Americans think the rich-poor gap is a very big problem. Among advanced countries, only Australians expressed a lower level of concern, but in Australia the top fifth earned just 2.7 times the income of the bottom fifth.
Wealth inequality is even greater than income inequality. NYU economist Edward Wolff has found that, while the highest-earning fifth of U.S. families earned 59.1% of all income, the richest fifth held 88.9% of all wealth.

