Generally, we expect that surveys representing the same target population should produce estimates that are consistent with one another; that is, measures taken at roughly the same time should not vary dramatically from survey to survey.
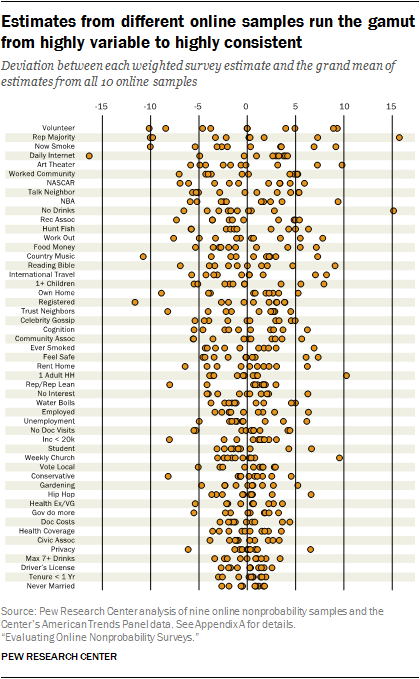
For some of the items in this study, this is the case. For example, the highest estimate for the proportion never married is only 4.4 percentage points higher than the lowest. The proportion living at their residence for less than a year and the proportion with a driver’s license are similarly consistent across samples. At the other end of the spectrum, estimates of the proportion who knew that the Republican Party controlled both the House of Representatives and Senate span over a range of 26 percentage points, from 52% (sample I) to 78% (American Trends Panel) with the others dispersed in between.
Other items exhibit more idiosyncratic patterns. The estimates of the share of adults who worry that computers and technology are being used to invade their privacy is densely clustered around 27% except for sample E, the low outlier at 21% and the ATP, the high outlier at 34%.
As we might expect, items closer to zero or 100% tend to display somewhat less variability between samples than items closer to 50%, though several items that fall near 50% exhibit low variability as well. For instance, the grand mean (average across all 10 samples) for the percentage who rate their health as excellent or very good is 47%, with samples differing from that by an average of 2.1 percentage points. The grand mean for the share that believes the government should do more to solve problems is 54% with an average deviation of 1.9 points.
Other than these ceiling and floor effects, there are no clear patterns that explain why some items vary across samples and others do not. Behavioral and attitudinal items are both well represented at both ends of the spectrum, as are potentially sensitive or socially desirable items. We also do not know if these patterns would persist if we were to repeat this exercise, as we lack measures of consistency over repeated surveys from the same sample sources.


