Data on Homicides, Suicides and Other Deaths and Data on Firearms Injuries
The Web-based Injury Statistics Query and Reporting System (WISQARS) is the primary source for data on deaths, homicides and suicides. WISQARS is part of the National Center for Injury Prevention and Control in the Centers for Disease Control and Prevention (CDC) and can be accessed at www.cdc.gov/ncipc/wisqars. It is also the primary source for data on non-fatal firearms related injuries.
WISQARS data on deaths are drawn from information contained in death certificates filed in state vital statistics offices. This information includes causes of death reported by attending physicians, medical examiners and coroners, including deaths due to firearms. The data also include demographic information about the deceased reported by funeral directors, who obtain that information from family members and other informants. Data on the annual number of deaths used in this report are drawn from WISQARS for 1981 through 2011.
WISQARS data on non-fatal firearms injuries come from the National Electronic Injury Surveillance System–All Injury Program (NEISS-AIP), a collaborative operation of the CDC’s National Center for Injury Prevention and Control (NCIPC) and the U.S. Consumer Product Safety Commission. Information is collected from a sample of hospital emergency rooms that represent a range of hospital types and locations. Data on non-fatal injuries can be accessed at http://www.cdc.gov/ncipc/wisqars/nonfatal/datasources.htm.
For this report, homicides are defined as fatal injuries inflicted by another person with intent to injure or kill. Note that deaths due to legal intervention or operations or deaths due to war are excluded. Justifiable homicide is not identified in the WISQARS data.
Calculating Annual Death Rates
Throughout this report, annual death rates per 100,000 people are shown based on data provided by WISQARS. The annual death rate is calculated as follows:
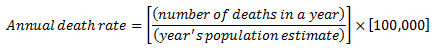
WISQARS provides the number of deaths in a given year. Population data, used in constructing rates, come from the Census Bureau’s annual population estimates. For 1990 through 2011, population estimates were obtained via WISQARS. For 1981 through 1989, population estimates were obtained from the Census Bureau through http://www.census.gov/popest/data/national/asrh/1980s/80s_nat_detail.html.
Data on Criminal Victimizations
Crime victimization estimates are drawn from the National Crime Victimization Survey (NCVS) of the Bureau of Justice Statistics (BJS). The NCVS provides national estimates of the levels and characteristics of criminal victimization in the U.S., including crimes not reported to police departments. The NCVS is an annual survey of some 140,000 persons ages 12 and older in about 80,000 households. A household that is selected participates in the NCVS for three years, with survey respondents interviewed every six months. In addition to persons living in households, the survey includes persons living in group quarters such as dormitories but excludes persons living in institutional settings such as military barracks, mental hospitals, or correctional facilities. The survey also excludes persons who are homeless or visiting from abroad.
The NCVS has been conducted annually since 1972 and is the primary source of information on crime victimizations in the U.S. NCVS respondents are asked about non-fatal personal crime victimizations such as rape, sexual assault, robbery, aggravated assault, simple assault and personal larceny. Respondents are also asked about household property crime victimizations such as burglary, motor vehicle theft and other thefts. Survey respondents who have been victims of a crime are then asked about details related to the crime, including whether the offender had a weapon, such as a gun. Fatal crimes such as homicides are not included in the NCVS. Respondent demographic characteristics are also collected.
NCVS data collection began in 1972. This report uses data collected from 1993, the first year employing an intensive methodological redesign, through 2011. In addition, analysis of crime victimizations is limited to those that occurred in the U.S. and criminal victimizations that occurred in a single data collection year.
This report analyzes victimizations and not incidents; more than one person may be victimized by a single incident.
Criminal Victimization Statistics and Measures
Most statistics based on the NCVS were obtained using the BJS’s online NCVS Victimization Analysis Tool (NVAT). The NVAT can be accessed through http://bjs.gov/index.cfm?ty=nvat. The BJS also provided the Pew Research Center with a single data file containing concatenated incident data files from the 1993 through 2011 NCVS data collections. That file was used to tabulate crime victimization statistics for those ages 25 to 40 and ages 41 to 64.
Two measures of victimization based on the NCVS are used in this report—the estimated number of crime victimizations and the estimated crime victimization rate per 100,000 population. These measures are reported for guns, or firearms, non-fatal violent crime victimizations and for all violent crime victimizations. In some cases, crime victimization estimates based a sample size of fewer than 10 cases are reported. These estimates are denoted by an asterisk (*) in the report’s appendix tables and should be interpreted with caution. For some demographic subgroups in some years, no crime victimization estimates are provided because of no sample cases were available. These instances are denoted with dashes (—) in the report’s appendix tables.
Throughout the report, NCVS data from 2006 are reported but should be interpreted with caution. In 2006, several methodological changes were made to the NCVS data collection that distinguish it from other years (Truman and Planty, 2012).
Counting Series Victimizations
The analysis in this report utilizes the protocol developed by the BJS to analyze series victimizations in the NCVS. A series victimization (or repeat victimization) involves a crime in which a victim finds it difficult to distinguish multiple incidents from each other and provide details of each individual incident. Examples of such crimes include intimate partner violence or bullying by schoolmates.
Since 2012 (Lauritsen, et. al., 2012), the BJS has developed the following protocol for counting series victimizations. Today, the BJS includes series victimizations in its annual estimates of victimization. For any given series victimization over a six-month period, up to 10 incidents are counted as individual criminal victimizations. Prior to 2012, series victimizations were often excluded from BJS victimization estimates.
As a result of this change, which has been incorporated into the data analysis for this report, the number of victimizations estimated in the NCVS for years prior to 2011 is higher than estimates published prior to 2012. For more details, see Criminal Victimizations, 2011 (Truman and Planty, 2012).
Testing Statistical Significance
Throughout the report, comparisons of crime victimization rates between demographic subgroups or comparisons of crime rates across years were tested for statistical significance. Since the NCVS has a complex sample design, any tests of statistical significance require taking that complex design into account.
For this report, all statistical tests for the NCVS were conducted using spreadsheets provided by the BJS. These spreadsheets contain formulas for statistical tests that account for the NCVS’s complex sample design.
Differences Between the NCVS and the UCR
The NCVS and the FBI’s Uniform Crime Report (UCR) data are the two main components of the nation’s crime reporting system. However, the two collections differ significantly in methodology and in crime definitions.
The NCVS is a survey of the general public ages 12 and older asking about crime victimizations, including those not reported to police. By comparison, the UCR covers crimes against persons and businesses known to and recorded by law enforcement agencies.
The universe of crimes measured in the NCVS and the UCR differs. For example, the UCR includes homicide, arson, and commercial crimes, while the NCVS does not.
The NCVS does not measure criminal victimizations among children under age 12, persons in institutions such as correctional institutions or nursing homes, homeless people or people from other countries who come to the U.S. for tourism, business or other temporary reasons. Victimizations among these groups may be included in the UCR.
According to the BJS (Truman and Planty, 2012), preliminary estimates from the FBI indicate that violent crimes and property crimes reported by the UCR declined from 2010 to 2011. By contrast, the NCVS reports that over the same period the number of violent crimes and property crimes increased. Even when limiting NCVS victimizations to those reported to police, the number of violent crimes and property crimes remained unchanged between 2010 and 2011.
Public Opinion Survey Methodology
The public opinion survey analysis in this report is based on a telephone survey of 924 adults ages 18 and older conducted March 14-17, 2013, in the continental U.S. Some 512 respondents were interviewed on a landline telephone and 412 were interviewed on a cellular telephone, including 197 who had no landline telephone. The survey was conducted by interviewers at Princeton Data Source and University Survey under the direction of Princeton Survey Research Associates International. Interviews were conducted in English. Respondents in the landline sample were selected by randomly asking for the youngest adult male or female who is now at home. Interviews in the cell sample were conducted with the person who answered the phone, if that person was an adult 18 years of age or older. The survey has a margin of error of plus or minus 3.9 percentage points at the 95% level of confidence.
The combined landline and cell phone sample are weighted using an iterative technique that matches gender, age, education, race, Hispanic origin and region to parameters from the 2011 Census Bureau’s American Community Survey and population density to parameters from the Decennial Census. The sample also is weighted to match current patterns of telephone status, based on extrapolations from the 2012 National Health Interview Survey. The weighting procedure also accounts for the fact that respondents with both landline and cell phones have a greater probability of being included in the combined sample and adjusts for household size among respondents with a landline phone. Sampling errors and statistical tests of significance take into account the effect of weighting.