McDonald’s and Starbucks are the yin and yang of franchise food and drink. While both are iconic American brands, each appeals to different lifestyles, budgets and, yes, even political ideologies.
How different? A Pew Research Center Social & Demographic Trends survey on where Americans would like to live included the following question: “Just for fun: Would you prefer to live in a place with more McDonald’s or more Starbucks?”
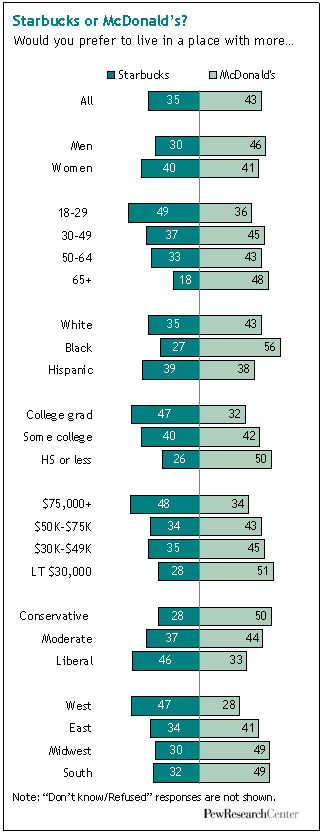
The Golden Arches won the head-to-head contest by 43%-35% (the remainder had no preference) in a telephone survey among a nationally representative sample of 2,260 adults conducted from Oct. 3 through Oct. 19, 2008.
But those numbers tell only part of the story. In this smackdown between Big Macs and caffe lattes, Americans manage to typecast themselves by just about every demographic and ideological characteristic under the sun.

Where to start? Well, ever heard the phrase: “latte-drinking liberal”? Evidently there’s something to it. Among self-described liberals, Starbucks carries the day, 46%-33%. Among conservatives, McDonald’s prevails, 50%-28%. Moderates, you guessed it, fall in between: McDonald’s draws 44% and Starbucks 37%.
The pattern by political party is similar, if not quite as polarized. McDonald’s wins among Republicans, Democrats and independents. However, its margin is much greater among the GOP (+20 percentage points) than among the other two groups (each +3 percentage points).1
How about the demographic differences?
Let’s take a tour:
- Gender. McDonald’s has a 16-percentage-point edge among the guys, while the two icons battle to a virtual tie with the fairer sex.
- Age. McDonald’s carries the day by a whopping 30 percentage points among adults 65 and above. But Starbucks has a 13-percentage-point edge among 18-to-29 year olds.
- Income. For a lot of consumers, especially in today’s hard times, McDonald’s is a staple while Starbucks is an indulgence. No surprise, then, that people with annual incomes of $75,000 and above tend to choose Starbucks, while those with incomes below $30,000 go with McDonald’s. (No surprise, either, that in the midst of a recession, McDonald’s has been having a banner sales year while Starbucks has had to lay off thousands of employees and close hundreds of stores.)
- Education. Does it take a college degree to appreciate the subtleties of an espresso macchiato? Apparently. College grads prefer Starbucks by 47%-32%, while those who have a high school degree or less give the nod to McDonald’s, 50%-26%.
- Region. Perhaps out of loyalty to Starbucks’ Seattle roots, Westerners favor the home team by 19 percentage points. Adults in all other regions go with McDonald’s — though by a narrower margin in the East (+7 percentage points) than in the South (+17 percentage points) or Midwest (+19 percentage points).
- Race. Blacks are much more partial to McDonald’s (+29 percentage points) than are whites (+8 percentage points). Hispanics split their ballots evenly.
- Religion. Protestants and Catholics both favor McDonald’s. The religiously unaffiliated choose Starbucks (+13 percentage points).
- Lifestyle. If you’re someone who likes a fast pace of life, Starbucks is your cup of joe (+17 percentage points). However, more than seven-in-ten Americans prefer a slow pace of life — and among this group, McDonald’s gets the nod (+16 percentage points).
As the tour makes clear, there’s no shortage of variables separating the burger-and-fry crowd from the latte lovers. Needless to say, some of these tend to reinforce others — for example, income and education usually go hand in hand.
To find out which variables carry the most independent weight, we conducted a multivariate regression analysis.2 It shows that, once one controls for all the factors cited above, the variables that do the most to explain whether someone chooses Starbucks over McDonalds are: having a college degree, having a high income, being a liberal, being a Westerner and being a woman. For example, other factors held constant, a liberal is 13 percentage points more likely than a non-liberal to favor Starbucks over McDonald’s.
There’s one last survey finding that may interest fast food junkies and espresso aficionados alike. It has to do with human happiness — one ingredient that’s close to the heart of both brands’ marketing campaigns. McDonald’s, after all, sells Happy Meals and uses a clown as its corporate spokesperson. And Starbucks doesn’t sell only coffee; it also sells stores that (in the words of the company mission statement) “are a haven, a break from the worries outside.”
So, whose camp followers are happier? Turns out we have a virtual tie: Some 31% percent of those who prefer to have a Starbucks in their community describe themselves as very happy. So do 29% of those who would rather have a McDonald’s in the neighborhood. And, for that matter, so do 27% of those who have no preference.
Bag of fries, cup of joe, none of the above: Don’t let the ad campaigns fool you. Happiness, apparently, is where you find it.
Pew Research Center Senior Editor Rich Morin and Research Analyst Wendy Wang contributed to this report.


