
The total fertility rate in the United States – the estimated number of children that the average woman will have in her lifetime, based on present trends – has generally declined over the past two decades. Against this backdrop, the federal government has been assessing ways to increase the nation’s birth rate.
As fertility rates decline both in the U.S. and internationally, here are five facts about fertility trends around the world. These facts are based on a Pew Research Center analysis of data from the United Nations and the Organization for Economic Cooperation and Development (OECD).
The total fertility rate in the U.S. stands at 1.6 live births per woman in 2025, according to UN estimates.
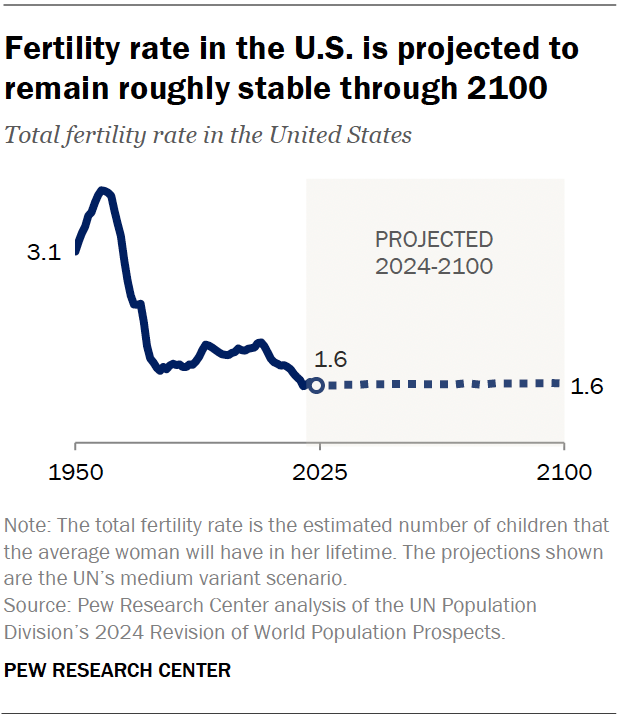
The UN projects the U.S. fertility rate will remain roughly stable through the end of the century.
Several long-term demographic factors have likely contributed to declining U.S. fertility, including increased educational attainment among women, delays in marriage and a drop in the teen birth rate.
Americans in their 20s and 30s are also planning to have fewer children than a decade ago, according to a recent Center analysis of government data.
The U.S. is not alone in experiencing long-term fertility decline. India and China – the world’s two most populous countries – have also seen decreases in fertility over several decades. Today, China’s estimated fertility rate is among the lowest globally at 1.0 births per woman.
Total fertility rates have declined in every world region since 1950. In Latin America and the Caribbean, for example, the average number of births per woman fell from 5.8 in 1950 to an estimated 1.8 in 2025.
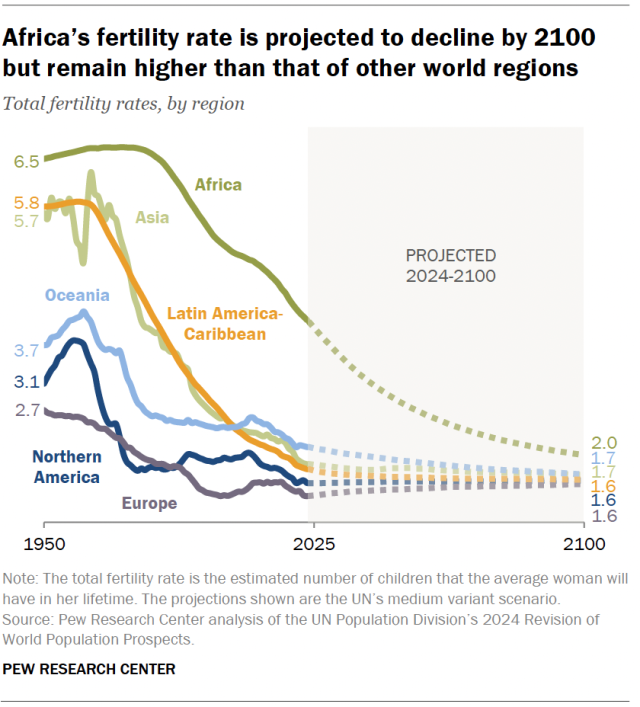
In Africa – the region with the highest historical and current fertility rate – the birth rate has decreased from 6.5 to 4.0 between 1950 and 2025.
Currently, Europe and Northern America have the world’s lowest fertility rates at 1.4 and 1.6 births per woman, respectively. (In the UN data, Northern America does not include Mexico, which is part of the Latin America-Caribbean region instead. Read more about how the UN classifies regions.)
By 2100, the UN projects that fertility rates will decline from 4.0 to 2.0 in Africa; from 2.1 to 1.7 in Oceania; from 1.9 to 1.7 in Asia; and from 1.8 to 1.6 in Latin America and the Caribbean. However, fertility rates are expected to remain steady in Northern America and increase slightly in Europe by the end of the century.
Africa is the only world region where the fertility rate is currently higher than the global replacement-level fertility. Africa’s fertility rate of 4.0 births per woman is substantially above the replacement level of around 2.1 births per woman.
What is the replacement-level fertility?
The replacement-level fertility is the total fertility rate needed to maintain a population at a constant size. Globally, this is estimated to be around 2.1 births per woman, although this varies according to mortality rates.
In Oceania, the fertility rate today is 2.1, about at the replacement level.
Current fertility rates are below the replacement threshold in Asia, Latin America and the Caribbean, Northern America, and Europe. This means that future generations in these regions are expected to be smaller in number than today.
In contrast, every region was above the replacement-level fertility in 1950. Northern America was the first region to fall below the replacement level, doing so in 1972. Europe followed three years later. The Latin America-Caribbean region dipped below the replacement level in 2014, and Asia did in 2019.
Oceania is projected to fall beneath the replacement level in 2028. However, Africa is not expected to do so until 2091, according to UN projections.
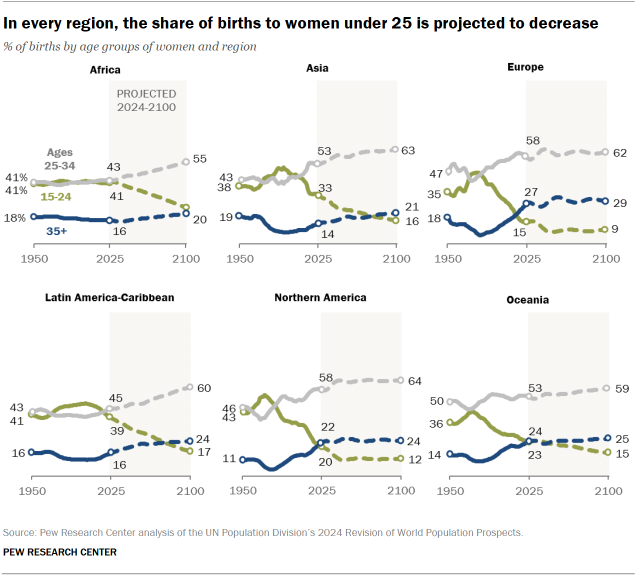
In every world region, the share of births to women under age 25 is projected to decline by 2100. In Africa, for instance, the share of babies born to women under 25 is projected to fall from 41% today to 24% in 2100. In Latin America and the Caribbean, it is projected to fall from 39% to 17%. In Asia, it is expected to decrease from 33% to 16%.
By 2100, women under 25 will bear a much smaller share of births than women ages 25 to 34 in each region. And in every region except Africa, they will also account for a smaller share of births than women older than 34.
Some countries have introduced policies to encourage people to have more children. These efforts have included financial incentives, expanded parental leave and increased access to child care. Yet there is limited evidence that such policies increase the fertility rate.
Since the end of its one-child policy in 2016, China’s government has been looking for ways to incentivize parenthood. Earlier this year, it announced a national plan that includes direct subsidies of about $500 per child each year until age 3. Local governments and state media have also subsidized or promoted having children.
Other East Asian governments are also taking steps to address low fertility rates, including by making parental leave and child care policies more generous. In 2021, Japan spent 2.4% of its gross domestic product (GDP) on family benefits, according to the most recent OECD data.
Related: Few East Asian adults believe women have an obligation to society to have children
In addition, several European countries spent more than 3.0% of GDP in 2021 on family programs such as child allowances, subsidized child care and tax breaks. For example, Poland spent around 3.6% of its GDP on family benefits, including 2.5% on child-related cash transfers. And Iceland spent around 3.8% of its GDP on this – the highest share in the OECD.
The U.S. spent about 1.0% of its GDP on these types of benefits in 2021, with most of that going toward services and tax breaks.

