
Even before Congress passed President Donald Trump’s major tax and domestic policy legislation, the federal government was on track to spend $1.9 trillion more this fiscal year than it collected in revenue, according to the nonpartisan Congressional Budget Office (CBO). The CBO now projects that the recently signed “megabill,” as it’s been dubbed, will add nearly $3.4 trillion more in deficit spending over the next decade.
When the government runs a deficit – that is, when it spends more in a year than it receives in revenue – it makes up the difference by borrowing. That means annual budget deficits add to the national debt, which was almost $37 trillion as of Aug. 8. While the “megabill” raised the federal debt limit by $5 trillion to $41.1 trillion, that’s not likely to be enough: The CBO estimates that the nation’s debt will exceed $52 trillion by the end of fiscal 2035.
Related: What to know about the bond market
With all that in mind, here are facts and figures about the national debt. For more about the statutory debt limit, read “Why does the U.S. have a debt limit, anyway?” above.
The nation’s debt is considerably bigger than its entire economy. Gross domestic product (GDP), the sum of all goods and services produced by the U.S. economy, was $30.3 trillion at the end of the second quarter of 2025 (June 30), according to the latest estimate by the Bureau of Economic Analysis (BEA). That means the debt, which stood at $36.2 trillion at the end of the second quarter, was 119.4% of GDP.

The debt-to-GDP ratio is a useful metric for analyzing the debt over long time spans because it puts the debt into the context of the overall economy. Looking at it this way, debt as a share of GDP has gone through three main growth phases in recent decades. These phases have corresponded with periods when the federal government ran large deficits: the Reagan-Bush years of the 1980s and early 1990s; the 2008 financial crisis and subsequent Great Recession; and the COVID-19 pandemic, when federal debt spiked to an all-time high of 132.8% of GDP in the second quarter of 2020, according to our analysis.
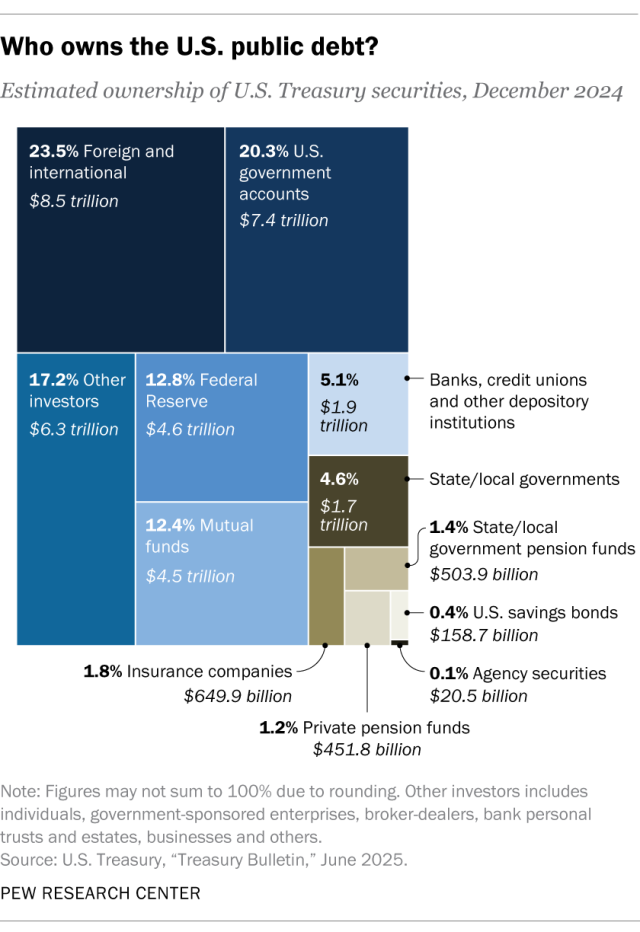
Private investors are the biggest holders of U.S. debt. Investors own about two-thirds of the national debt, or $24.4 trillion as of March 2025, the latest figures available. The rest is held in various federal trust funds and retirement programs ($7.3 trillion, or 20.1%) or by the Federal Reserve System ($4.6 trillion, or 12.6%).
Social Security’s two trust funds (one for retirement benefits, one for disability insurance) together held nearly $2.7 trillion in special Treasury securities as of July 2025. Various military retirement funds held more than $2.2 trillion. And Medicare’s two trust funds held a combined $425.3 billion.
Because of data lags, we have to go back to December 2024 for a closer look at the private investors who hold the national debt. At that time, about $8.5 trillion (23.5% of the total) was held overseas, either by individuals or foreign governments. Mutual funds held nearly $4.5 trillion, or 12.4%. Banks and similar institutions held nearly $1.9 trillion, or 5.1%, while states and localities owned almost $1.7 trillion, or 4.6%. Public and private pension funds together held $955.7 billion in U.S. debt, or 2.6%. The rest was held by a mix of individuals, businesses, insurance companies, broker-dealers and others.
Japan is the biggest foreign holder of U.S. debt. As of May 2025, Japan held more than $1.1 trillion, or 3.1%, of the country’s total debt. Following Japan were the United Kingdom ($809.4 billion, or 2.2%) and China ($756.3 billion, or 2.1%).
Interest on the national debt exceeds annual spending on Medicare, as well as national defense. In fiscal 2024, the government’s net interest expense was $879.9 billion, or 13% of all that year’s expenditures, according to data from the Office of Management and Budget. That was the highest share in a quarter-century. In dollars, it was slightly more than the government spent on Medicare ($874.1 billion) or national defense ($873.5 billion) in fiscal 2024. Interest on the debt is now the government’s third-biggest major spending area, behind only Social Security and health care services and research.
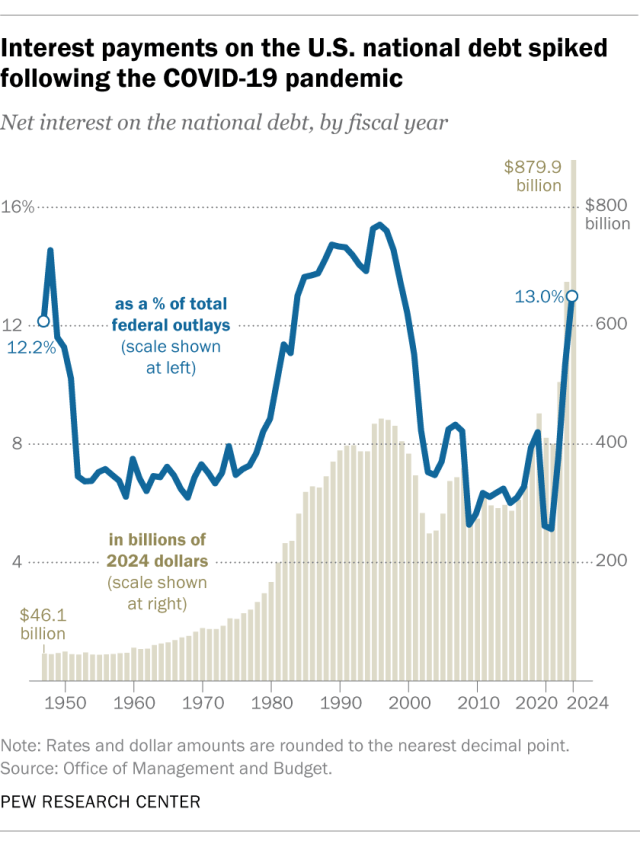
Net interest on the debt as a share of total federal outlays topped 15% in the mid-1990s. But for more than two decades thereafter, generally falling interest rates helped to constrain the government’s annual interest costs, even as the total debt load continued to grow.
That changed dramatically in the spring of 2022, when the Federal Reserve began raising its policy rate – ultimately to its highest level in 15 years – to bring down soaring inflation. One side effect of that policy shift is that the U.S. has started paying more to borrow.
The average interest rate on all federal debt, which had been as low as 1.556% in January 2022, has more than doubled to 3.352% as of July 2025. While still well below the levels of the 1980s and 1990s, that was the highest average rate since the 2007-09 Great Recession.
Note: This is an update of an analysis originally published on Oct. 9, 2013.
