
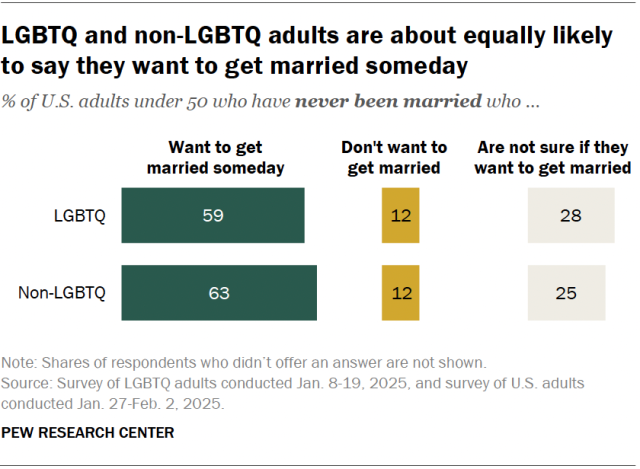
Ten years after the Supreme Court legalized same-sex marriage, 59% of LGBTQ U.S. adults under 50 who have never married say they want to get married someday. A similar share of non-LGBTQ adults in this age range say the same (63%).
However, LGBTQ adults under 50 who don’t have children are much less likely than their non-LGBTQ peers to say they want children someday (33% vs. 47%).
These findings are based on two Pew Research Center surveys conducted in January and February.
Views on getting married
Among LGBTQ and non-LGBTQ adults who have never been married, there are no notable differences by gender in the shares who want to get married someday.

However, those ages 18 to 29 are more likely than those ages 30 to 49 to say they want to get married someday:
- 67% vs. 48% among LGBTQ adults
- 73% vs. 49% among non-LGBTQ adults
In turn, larger shares of those ages 30 to 49 than those ages 18 to 29 in each group say they don’t want to get married.
Related: The Experiences of LGBTQ Americans Today
What about those who have already been married?
Among adults younger than 50 who are divorced, widowed or separated, LGBTQ adults are more likely than non-LGBTQ adults to say they want to get married again someday (46% vs. 33%).
Similar shares in both groups say they don’t want to get married again. But a larger share of non-LGBTQ than LGBTQ adults say they are not sure (37% vs. 25%).
Views on having children
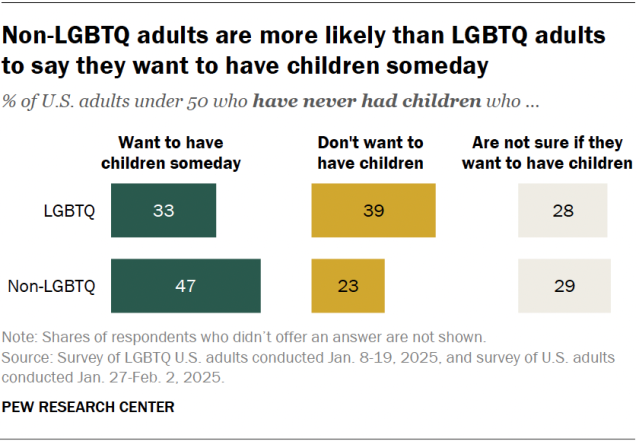
Among non-LGBTQ adults under 50 who don’t have children, 47% say they want kids someday. A much smaller share of their LGBTQ counterparts (33%) say the same.
In turn, LGBTQ adults are much more likely than non-LGBTQ adults to say they don’t want to have children (39% vs. 23%).
Meanwhile, significant shares of both LGBTQ adults (28%) and non-LGBTQ adults (29%) are not sure if they want children.
Differences by gender
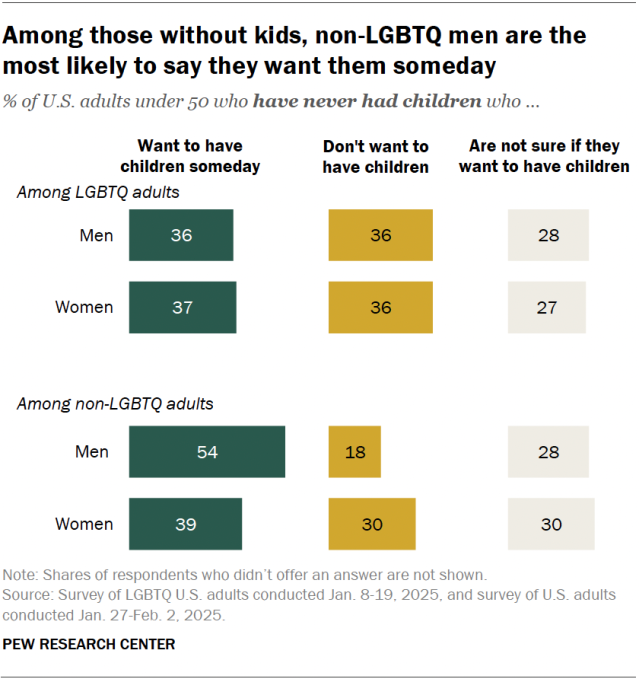
LGBTQ men and women are equally likely to say they want to have children someday (36% and 37%).
But among non-LGBTQ adults, 54% of men say they want to become parents someday, compared with 39% of women.
This gender difference is largely driven by the preferences of non-LGBTQ Republican men. Most in this group (66%) say they want children someday. Far fewer Republican women (42%), Democratic men (43%) and Democratic women (38%) say the same. (Republicans and Democrats include those who lean toward either party.)
Differences by age
Like marriage, those ages 18 to 29 are more likely than those ages 30 to 49 to say they want to have children someday:
- 59% vs. 34% among non-LGBTQ adults
- 36% vs. 27% among LGBTQ adults
Meanwhile, larger shares of those ages 30 to 49 than those ages 18 to 29 in each group say they don’t want to have kids.
Related: Same-Sex Parents Raising Kids
Note: Here are the questions used for this analysis, the toplines, and the methodologies for the survey of LGBTQ adults and the survey of non-LGBTQ adults.

