
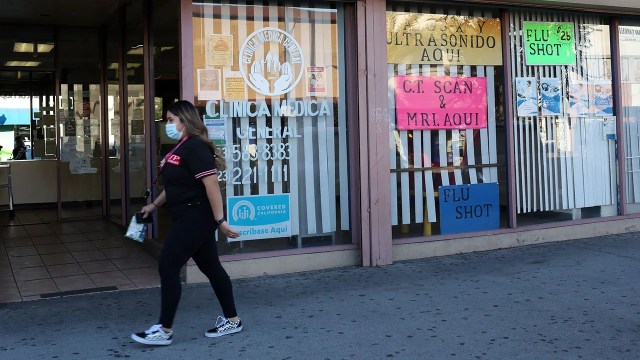
Hispanic Americans have long faced health care challenges in the United States, including lower health insurance coverage rates and less access to preventative care.
Language and cultural barriers, as well as higher levels of poverty, are among the social and economic factors contributing to disparate health outcomes for Hispanic Americans. These disparities were apparent during the early stages of the COVID-19 pandemic, when Hispanics were far more likely than White Americans to have died from the virus.
Pew Research Center conducted this analysis to highlight Hispanic Americans’ attitudes about and experiences with health care. We surveyed U.S. adults from Nov. 30 to Dec. 12, 2021, including 3,716 Hispanic adults (inclusive of those who identify as any race). A total of 14,497 U.S. adults completed the survey.
The survey was conducted on the Center’s American Trends Panel (ATP) and included an oversample of Black and Hispanic adults from the Ipsos KnowledgePanel. Respondents on both panels are recruited through national, random sampling of residential addresses. This way nearly all U.S. adults have a chance of selection. The survey is weighted to be representative of the U.S. adult population by gender, race, ethnicity, partisan affiliation, education and other categories. Read more about the ATP’s methodology.
Here are the survey questions used for this analysis, along with responses, and its methodology.
This study was informed by a group of advisers with expertise related to Black and Hispanic Americans’ attitudes and experiences in science, health, STEM education and other areas. Pew Research Center remains solely responsible for all aspects of the research, including any errors associated with its products and findings.
This analysis includes additional information from sources including KFF and the U.S. Census Bureau. Further information about these sources can be found through the links in the text.
Here are five key facts about Hispanic Americans and health care, based on a 2021 Pew Research Center survey of Hispanic adults and other sources:
Hispanic adults are less likely than other Americans to have seen a health care provider recently and to have a primary care provider. Seven-in-ten say they’ve seen a doctor or other health care provider in the past year, compared with 82% among Americans overall. Hispanics are also slightly less likely than Americans overall to say they have a primary care provider (68% vs. 76%).
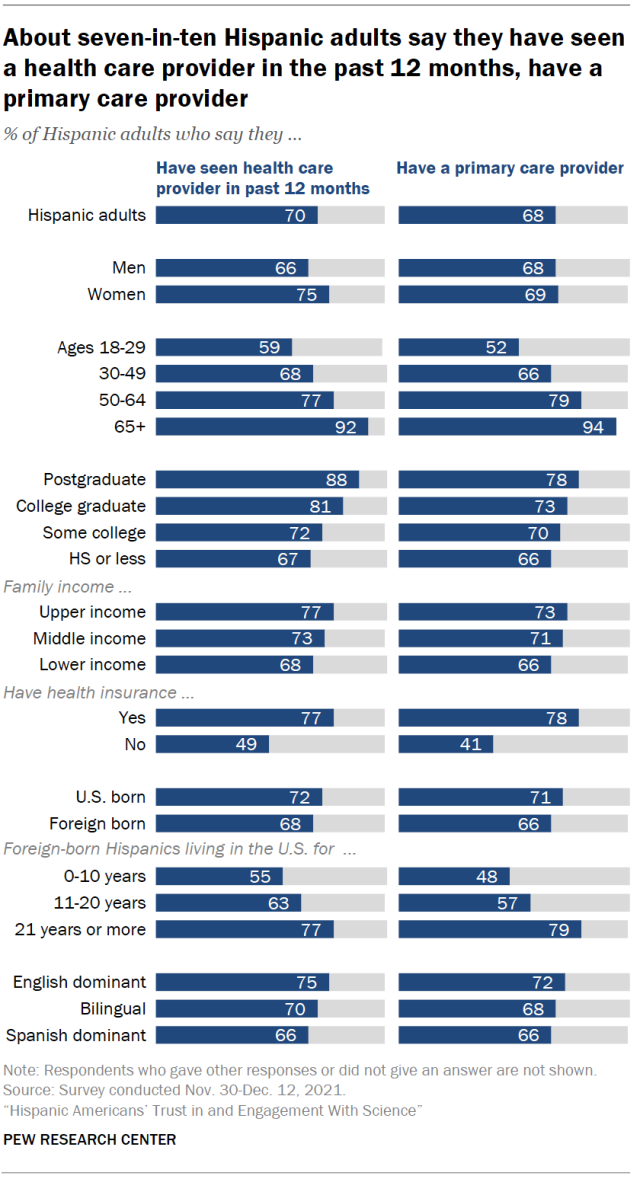
Health care access among Hispanic immigrants differs markedly based on how long they have lived in the U.S. More recent arrivals are less likely than those who have been in the country longer to have seen a doctor recently and to have a primary care provider. For example, 48% of Hispanic immigrants who have been in the U.S. for a decade or less report having a primary care provider, compared with 79% among those who have been in the U.S. for more than two decades.
Recent arrivals make up a declining share of Hispanic immigrants in the U.S. And more broadly, immigrants account for a declining share of the overall U.S. Hispanic population. In 2021, they made up 32% of all Hispanic Americans, down from 37% in 2010.
Hispanic Americans are less likely than people of other racial and ethnic backgrounds to have health insurance. As of 2021, the uninsured rate among Hispanics under age 65 was 19%, according to KFF, formerly known as the Kaiser Family Foundation. That was higher than the share among Black (11%), White (7%) and Asian Americans (6%). (These figures include rates among children as well as adults.)
While comparatively high, the uninsured rate among Hispanic Americans under age 65 in 2021 was down from 33% in 2010, before the implementation of the Affordable Care Act, according to KFF.
Lower rates of health insurance coverage play a major role in Hispanic Americans’ less frequent interactions with health care providers.
The relative youth of the U.S. Hispanic population may be another factor at play. The median age of Hispanic Americans was 30 as of 2020, compared with 41 for non-Hispanic Americans, according to the U.S. Census Bureau. Among both Hispanic and non-Hispanic Americans, younger people are less likely than their elders to have seen a health care provider recently and to have a primary care provider.
Many Hispanic Americans say worse health outcomes for Hispanics are tied to occupational and structural factors. Some 53% of Hispanic adults say a major reason why Hispanic people generally have worse health outcomes is that they’re more likely to work in jobs that put them at risk for health problems. About half (48%) say a major reason is that Hispanic people have less access to quality medical care where they live.
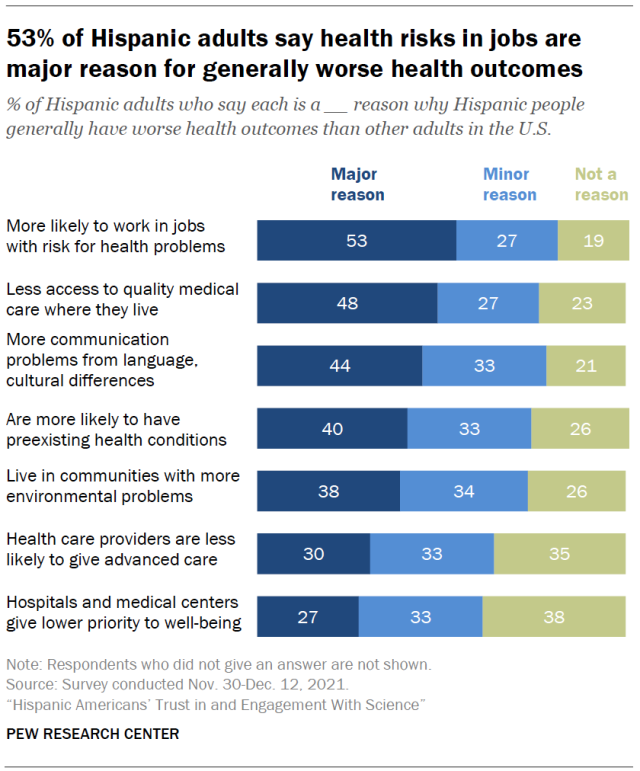
At least four-in-ten Hispanic adults also point to communication problems arising from language or cultural differences (44%) and preexisting health conditions (40%) as major reasons. (Majorities view all of these factors as at least minor reasons for disparate health outcomes among Hispanic adults.)
The coronavirus outbreak took an especially heavy toll on Hispanic Americans when compared with White Americans. Hispanics also face higher rates of certain diseases like diabetes than some other Americans.
When it comes to progress in health outcomes for Hispanic people, 51% of Hispanic adults say health outcomes have gotten a lot or a little better over the past two decades, compared with 13% who say they’ve gotten a lot or a little worse; 34% say they’ve stayed about the same.
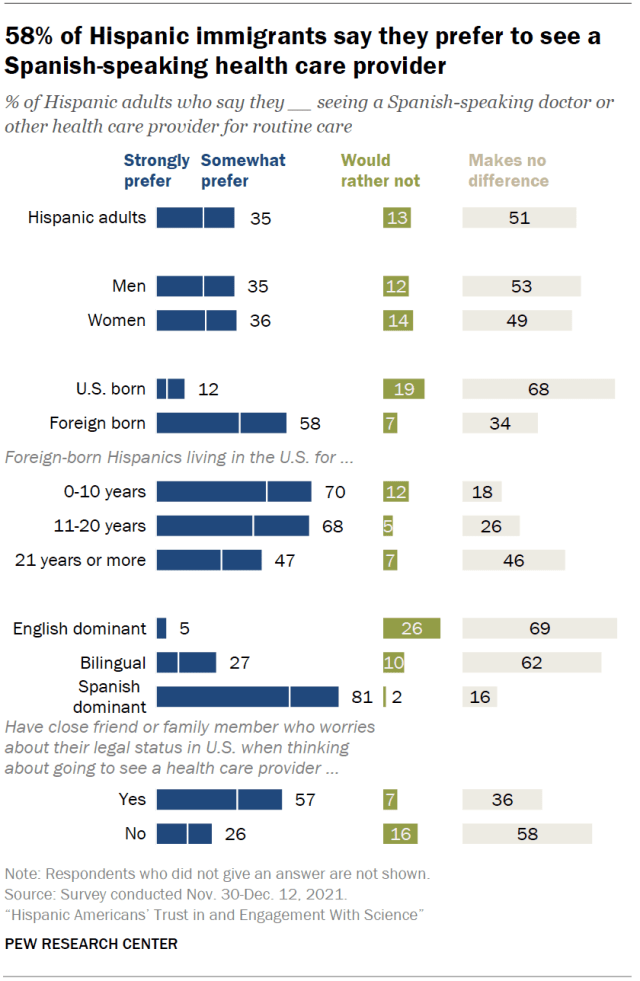
About a third of Hispanic Americans – including 58% of Hispanic immigrants – say they prefer to see a Spanish-speaking health care provider. Overall, 35% of Hispanic adults strongly or somewhat prefer seeing a Spanish-speaking doctor or other health care provider for routine care. A larger share (51%) say it makes no difference whether the doctor they see speaks Spanish or not. And 13% say they would rather not see a Spanish-speaking doctor.
Attitudes are broadly similar when it comes to seeing a Hispanic doctor or health care provider. A third of Hispanic adults say they would prefer to see a Hispanic doctor for routine care, while 59% say it makes no difference and 7% would rather not.
Among Hispanic adults, immigrants are much more likely than those born in the U.S. to prefer seeing a Spanish-speaking doctor (58% vs. 12%) and to prefer seeing a Hispanic doctor (47% vs. 20%). About half of Hispanic immigrants in the U.S. mostly speak and read in Spanish.
Hispanic Americans account for 19% of the U.S. population. But only 9% of the nation’s health care practitioners and technicians are Hispanic, according to a 2021 Pew Research Center analysis of federal government data. And just 7% of all U.S. physicians and surgeons and 7% of registered nurses are Hispanic.
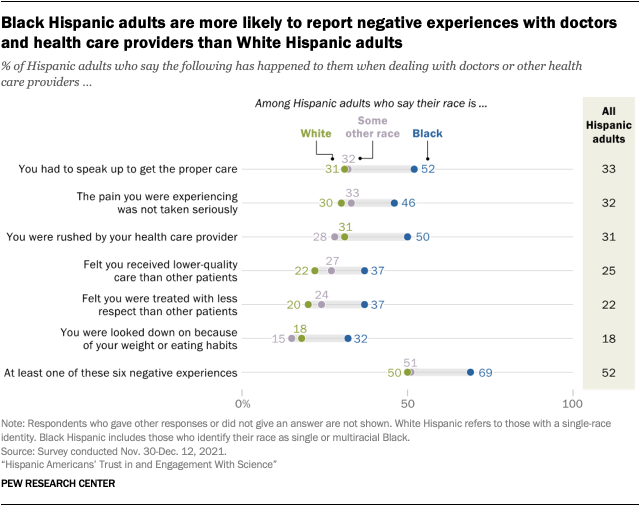
Black Hispanic adults are more likely to report negative health care experiences than other Hispanic adults. Overall, about half of Hispanic adults (52%) say they’ve had at least one of six negative health care experiences asked about in the Center’s 2021 survey, including feeling rushed or having to speak up to get the proper care. This is similar to the share of all U.S. adults who report having at least one of these types of negative experiences.
However, there are notable differences among Hispanics by race. Hispanic Americans who identify as Black are much more likely than White Hispanic adults to have faced negative health care experiences. For instance, 52% of Black Hispanic adults say they’ve had to speak up to get proper care, compared with 31% of White Hispanic adults. And Black Hispanic adults are 15 percentage points more likely than White Hispanic adults to say they’ve received lower-quality care (37% vs. 22%).
While negative health care experiences are fairly common, most Hispanic adults have generally positive opinions about their latest health care interaction. A 56% majority say the quality of care they most recently received from doctors or other health care providers was excellent or very good, while another 28% say it was good. Fewer (14%) say the care they received was only fair or poor. Black and White Hispanic adults are about equally likely to give positive ratings of their most recent health care experience.
Note: Here are the survey questions used for this analysis, along with responses, and its methodology.

