
While U.S. tariffs as a whole continue to be at or near their lowest levels ever, the duties imposed on specific imported goods vary widely depending on what they are and where they’re coming from. In general, the stiffest tariffs are levied on apparel and clothing.
Last year, according to data from Census Bureau (accessed via the U.S. International Trade Commission‘s DataWeb tool), import duties totaled $33.1 billion – equal to 1.4% of the total value of all imported goods, and 4.7% of the value of all imports subject to duty. (Most imported goods carry no duty at all. Only 30.4% of the $2.33 trillion in total imported goods, or about $708.6 billion, were subject to duty; the rest entered the U.S. freely.)
But those overall figures conceal a vast and complex array of individual tariff rates, on thousands of precisely defined import categories. These are spelled out in the Harmonized Tariff Schedule of the United States, the latest edition of which runs to 3,713 pages – almost as long as the Internal Revenue Code. The HTS, as it’s known, gets very specific: It will tell you, for instance, how the duty on “artificial flowers, foliage and fruit” differs depending on whether the objects in question are made from plastic (8.4%), feathers (4.7%) or man-made fibers (9%).
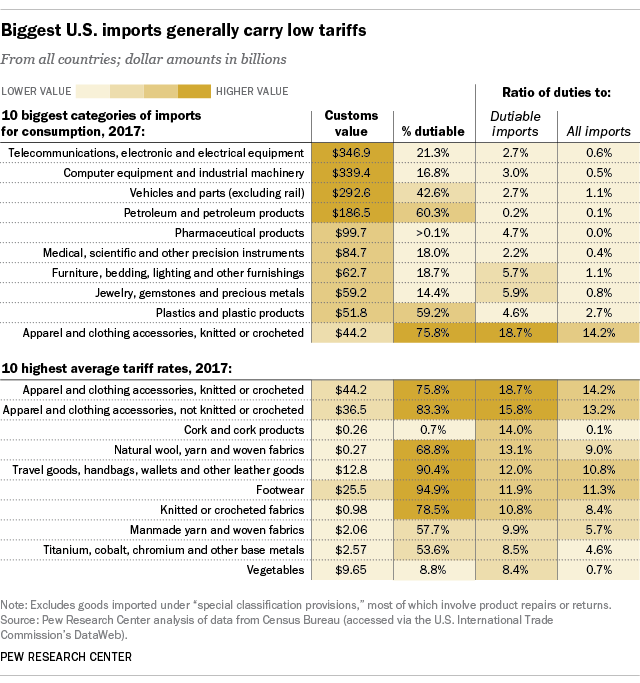
Broadly speaking, the largest categories of U.S. imports tend to carry relatively low tariff rates, while the highest rates usually are found in relatively small categories. Clothing is the main exception: The two main classifications of “apparel and clothing accessories” together accounted for $80.6 billion in imports last year (3.5% of the total); nearly $64 billion of those imports, or 79%, were “dutiable” – that is, subject to duty. The average tariffs on the dutiable portions were 18.7% for knitted or crocheted clothing, and 15.8% for non-knitted or crocheted items – the two highest average rates out of 98 broad import categories. Footwear was close behind: Nearly all of the $25.5 billion in imported footwear is subject to duty, at an average rate of 11.9%.
By contrast, average duties were far lower on “electrical machinery and equipment,” the single largest category of imported goods. This category includes telecommunications gear, computer chips, TVs and broadcasting equipment, electrical transformers, and related products. The U.S. imported nearly $347 billion worth of such goods last year, but only 21.3% of them carried a duty; the average duty on that portion was just 2.7%.
Computer equipment and industrial machinery is the next-biggest import category ($339.4 billion), but only $57 billion of those imports are taxed, at an average rate of 3%. “Vehicles and parts” accounted for $292.6 billion in imports but generated less than $3.4 billion in tariff revenue (2.7% of the dutiable value).
The imported steel products singled out for 25% tariffs by President Donald Trump’s administration totaled $29.3 billion last year, according to our analysis of ITC data; all of them had been duty-free before. The categories of aluminum imports specified for an additional 10% tariff in Trump’s order amounted to just under $17 billion; about a fifth of those imports already were subject to duties, averaging 3.5% of the assessed value. (Steel and aluminum imports from Canada and Mexico, however, were excluded from the new tariffs, pending the outcome of ongoing talks to renegotiate the North American Free Trade Agreement.)
Minerals and metals, as it happens, are one of the classes of imports on which the U.S. has had particularly low tariffs, according to data from the latest “World Tariff Profiles” report, produced jointly by the World Trade Organization, International Trade Centre and UN Conference on Trade and Development. The “average most-favored-nation applied duty” on minerals and metals was 1.7%, or 125th out of 138 countries and other economic units. (The “most favored nation,” or MFN, part of that metric refers to the tariffs each WTO member country promises to apply to all other WTO members, unless they’re part of a free trade area, customs union or other “preferential trade agreement.” Also, the report treats the 28-member European Union as a single entity, and it covers Hong Kong and Macao separately from the rest of China.)
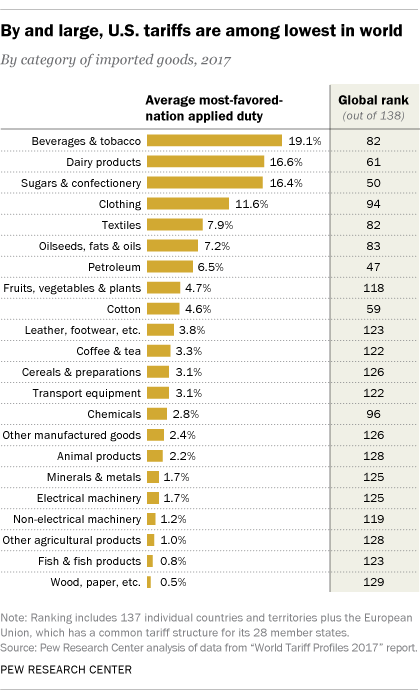
The highest U.S. import taxes relative to the rest of the world are on petroleum: The average MFN applied rate of 6.5% is tied for 47th place, with Costa Rica. (The Cook Islands, an autonomous part of New Zealand, has the highest average petroleum tariffs: a whopping 168%.) Also relatively high are U.S. tariffs on imported sugars and confectionery: The 16.4% average MFN tariff ranks 50th out of 138, though it’s nowhere near the 93.4% imposed by Turkey.
In general, countries tend to place their highest import duties on beverages (read: alcohol) and tobacco, which helps explain why that’s most of what you’ll find on the shelves at “duty-free shops” at international airports. The average MFN applied tariff on the “beverages and tobacco” category, according to the WTO data, is 35.8%. (The U.S. average rate, by contrast, is 19.1%.) Egypt takes the prize here, with an 803% average applied tariff on beverages and tobacco.
