
Election watchers and pollsters focus on any number of subgroups, from white born-again women to first-generation Latinos to men without college degrees. But one group that’s not often singled out in surveys is Americans with disabilities, even though they are as engaged with the election as the general public. The potential of the disabled as a voting bloc has also attracted attention in this year’s campaign.
To be sure, there are many kinds of disabilities, and not all Americans with disabilities are alike. Here, we look at whether and how Americans who self-identify as having a disability differ from those who do not in terms of the 2016 election.
Overall, Americans with disabilities have thought about the upcoming election and care about who wins at rates similar to Americans without disabilities. However, on the whole, those with disabilities are less likely to turn out to vote on Election Day as they face a number of obstacles to voting.
More than 56 million Americans, or 19% of the population, are living with some form of disability – whether physical, mental or communicative, according to the Census Bureau. And recent projections suggest that 35.4 million disabled Americans will be eligible to vote in the 2016 election (roughly 17% of the electorate).
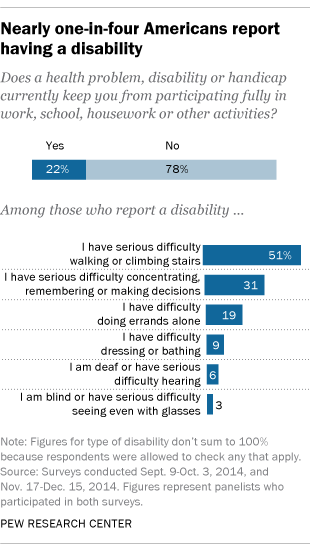
A new analysis of data from Pew Research Center’s American Trends Panel finds a slightly different share than the Census Bureau: the Center found that 22% of Americans self-report living with a disability, defined here as a “health problem, disability, or handicap currently keeping you from participating fully in work, school, housework, or other activities.” Of those who say they have a disability, half (51%) say they have “serious difficulty walking or climbing stairs,” 31% say they have “serious difficulty concentrating, remembering or making decisions” and 19% say they have difficulty doing errands alone.
Due to the nature of the surveys associated with this data, certain Americans with disabilities are likely undercounted. The initial recruitment surveys for the American Trends Panel were conducted on landlines and cellphones and likely under-covered adults who are deaf or have difficulty speaking. The estimates reported here are from panel surveys conducted via the web and mail, which may underrepresent blind people. In addition, our surveys do not cover those living in institutionalized group quarters, which may include some severely disabled individuals.
Here is how disabled Americans compare with the general public, both in terms of similarities and differences:
Interest and engagement in the election
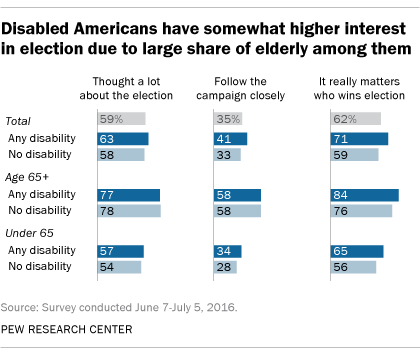
Those self-identifying as disabled are somewhat more likely than the general public to report being particularly engaged with this election. In a survey conducted in June, fully 71% of Americans with disabilities said it “really matters who wins the election,” compared with 59% of Americans who do not have a disability.
Similarly, 41% of those who are disabled were following the campaign “very closely” in June. By comparison, 33% of Americans without disabilities said the same.
These differences are driven primarily by the fact that the disabled, as a group, are disproportionately older than the population. Though not all disabled Americans are older Americans, many of those 65 and older report being in some way disabled. And older Americans generally tend to be more attentive to politics and government than their younger counterparts. In other words, it is likely age and not disability status that drives their level of political engagement.
Voter registration and turnout
In terms of voting, those with self-reported disabilities are indistinguishable from the general public in terms of voter registration, with 80% reporting they are registered to cast a ballot, compared with 84% of those without a disability.
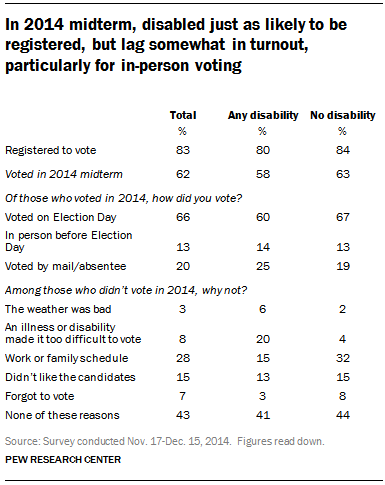
But when it comes to the share reporting that they actually voted in past elections, the analysis suggests that there are gaps in past voting behavior: 58% of disabled Americans voted in the 2014 midterm election, while 63% of Americans without disabilities say they did the same. The gap is somewhat wider when age is taken into account. For example, disabled seniors are less likely to vote (69% reported voting in 2014) than those 65 and older without a disability (86%). In the 2012 general election, the same was true – those with disabilities were less likely to vote than those who do not have a disability.
In addition to being less likely to vote, Americans with disabilities who do vote are less likely to do so in person. Fully two-thirds (67%) of Americans who are not disabled voted in person on Election Day in 2014. Six-in-ten (60%) of Americans with disabilities did the same. By contrast, 25% of Americans with disabilities voted by mail or absentee compared with 19% of those who are not disabled.
Among those who did not turn up to vote on Election Day 2014, 20% of those with disabilities pointed to an illness or disability that “made it too difficult to vote.” Just 4% of those without disabilities provided the same reason.
Research from Rutgers University suggests that while Americans with disabilities do face more challenges to voting, they do not feel they are treated any differently. According to Rutgers’ research, the most common impediments to voting reported by voters with disabilities were difficulty in reading or seeing the ballot and understanding how to vote or use voting equipment. Despite impediments, however, Americans with disabilities were just as likely as those without disabilities to say they were treated respectfully by election officials.
Politics and ideology
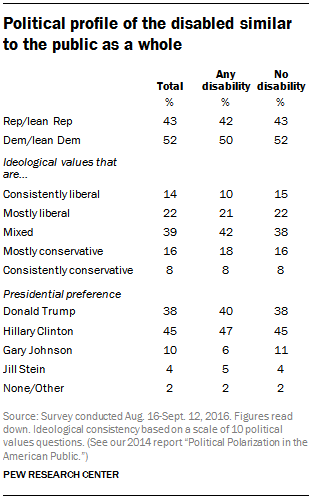
To the extent that they do turn out to vote, does the presence or absence of the disabled in the voting booth have the potential to swing an election one way or the other? The data suggest the answer is no. Rather than having one distinct partisan profile, Americans with disabilities look similar to those without disabilities both in terms of party affiliation and their distribution across the ideological spectrum. And, in a survey conducted in August and early September, the presidential preferences of disabled voters were little different than those of the public as a whole.
Using a scale composed of 10 political values questions (discussed in more detail in Pew Research Center’s 2014 report “Political Polarization in the American Public”), fully four-in-ten Americans with disabilities express a mix of conservative and liberal political values, 31% take more liberal than conservative positions across these 10 questions and 26% are more conservative than liberal in their values. That closely matches those without disabilities, with Americans without disabilities being slightly more likely to hold consistently liberal positions.
