
Now that the Supreme Court has finished its 2013-14 term, legal scholars and court watchers have another 67 decisions (in argued cases) to analyze and refine their models of how the Court works. One development was noted by several commentators: Despite the oft-described ideological and jurisprudential divisions among the justices, they agree a lot more often than they disagree.
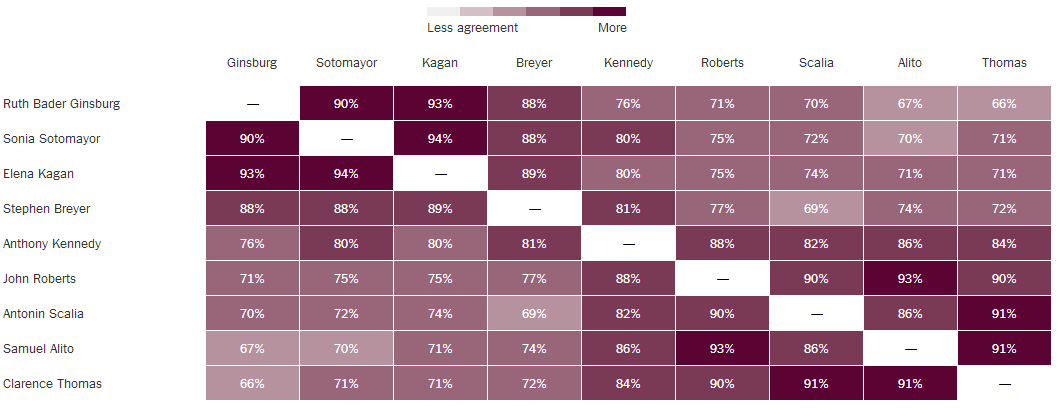
The chart above, from The New York Times, shows how often each justice has sided with every other justice in the 280 decisions issued since 2010 (the Court’s lineup has been stable since Elena Kagan joined it in 2010). The highest agreement rates, as might be expected, are between justices appointed by the same President: Sonia Sotomayor and Elena Kagan, 94% (both appointed by Obama) and John Roberts and Samuel Alito, 93% (both appointed by George W. Bush). But even the two most disparate justices, Ruth Bader Ginsburg and Clarence Thomas, have been on the same side nearly two-thirds of the time.
That has much to do with the large number of unanimous decisions the Court has issued. Two-thirds of this past term’s decisions, the Times notes, were 9-0 — the highest percentage since at least 1953 — including ones on abortion-clinic protests and police searches of smartphones.
Chief Justice Roberts, Court observers say, has worked hard to try to have the Court speak with a single voice as often as possible. But even when they agree on the outcome of a case, the justices frequently disagree on the legal reasoning, spelling out their views in concurring opinions that sometimes read almost like dissents.
