
Every year, Transparency International asks people around the world about their experiences with public corruption — more than 114,000 in 107 countries for their latest “Global Corruption Barometer.” The map below depicts the percentage of people in each of the surveyed countries who reported paying a bribe sometime in the past 12 months to any of eight public services; the scale runs from green (lowest) to red (highest).
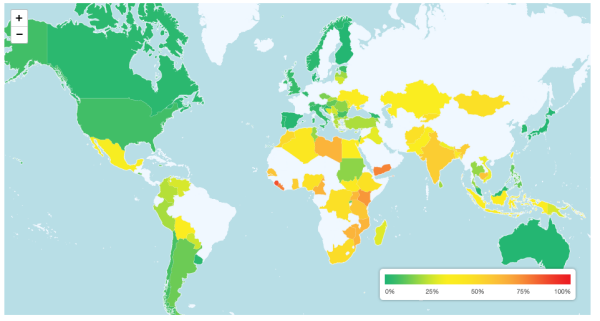
The survey found that 84% of people in Sierra Leone reported paying bribes. The United States came in at a respectable 7%, but at the very bottom (or top, perhaps) were Australia, Denmark, Finland and Japan, where just 1% in each country reported paying bribes. (One reason we liked Transparency’s map is because, by clicking on each country, you can get the percentage of self-reported bribers. The same website also has other interactive corruption-related maps.)
It’s interesting to compare the Transparency International results with Ernst & Young’s latest survey of business fraud in Europe, the Middle East, India and Africa. While corruption perceptions in some countries are quite similar in the two surveys, they vary dramatically in others. For instance, 96% of Slovenian respondents in the Ernst & Young survey said that bribery and corruption were widespread in their country. But in the Transparency survey, only 6% of Slovenians said they themselves had paid a bribe in the past 12 months.
