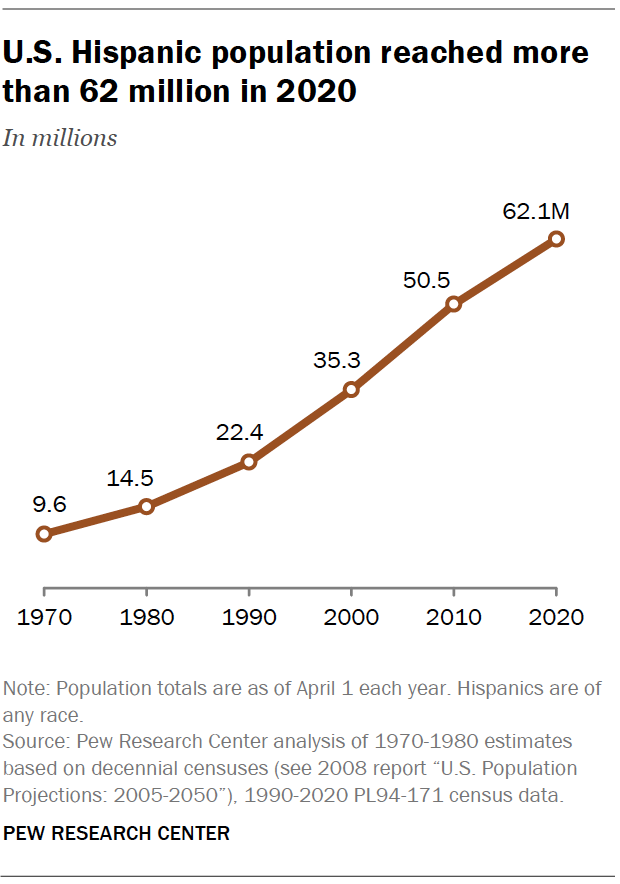
The U.S. Hispanic population reached 62.1 million in 2020, accounting for 19% of all Americans and making it the nation’s second largest racial or ethnic group, behind White Americans and ahead of Black Americans, according to the U.S. Census Bureau. It is also one of the fastest growing groups in the U.S. Between 2010 and 2020, the country’s Hispanic population grew 23%, up from 50.5 million in 2010 (the Asian population grew faster over the same decade). Since 1970, when Hispanics made up 5% of the U.S. population and numbered 9.6 million, the Hispanic population has grown more than sixfold.
Latinos are reshaping national and state-level demographics
With such sizable and rapid growth, U.S. Latinos have shaped the nation’s demographic story for several decades. From 2010 to 2020, they accounted for about half of U.S. population growth, a pattern continued from 2000 to 2010. As a result, the Latino population has grown in just about every corner of the nation. Today, while California, Texas and Florida hold about half of the U.S. Latino population, the fastest growth rates are in states such as North Dakota (up 148% between 2010 and 2020) and South Dakota (up 75% over the same period).
Growing Hispanic populations are also reshaping the demographics of states. In the last decade, Hispanics became the largest racial or ethnic group in California for the first time. California joins New Mexico as the two U.S. states where Hispanics are the largest racial or ethnic group. And the future demographics of many states are poised to be further shaped by Hispanics. In 2000, in eight states, 20% or more of kindergartners were Hispanics. By 2017, that number had grown to 18 states plus the District of Columbia.
The diverse origins of U.S. Hispanics
Hispanics are a diverse group with deep roots in Latin America. In 2019, 61.5% of all Hispanics indicated they were of Mexican origin – either they were born in Mexico or traced their ancestor’s roots to Mexico, according to Center analysis of U.S. Census Bureau data. At 37.2 million people in 2019, this makes the Mexican origin population the largest among U.S. Hispanics.
The next largest group is Latinos of Puerto Rican origin – those born either in Puerto Rico or who trace their family’s roots to Puerto Rico. Puerto Ricans account for 9.7% of the U.S. Latino population. Cubans, Salvadorans, Dominicans, Guatemalans, Colombians and Hondurans all round out the largest groups, each with a population of a million or more in 2019.
At the same time, the origins of Hispanics have been changing. Between 2010 and 2019, the fastest growing origin groups were Venezuelans (up 126%), Guatemalans (up 49%) and Hondurans (up 47%). By comparison, the Mexican population grew just 13% over the same period, and the Ecuadorian population grew the slowest, just 6% between 2010 and 2019.
U.S. born Latinos comprise a majority, immigrants make up a declining share of U.S. Latinos today
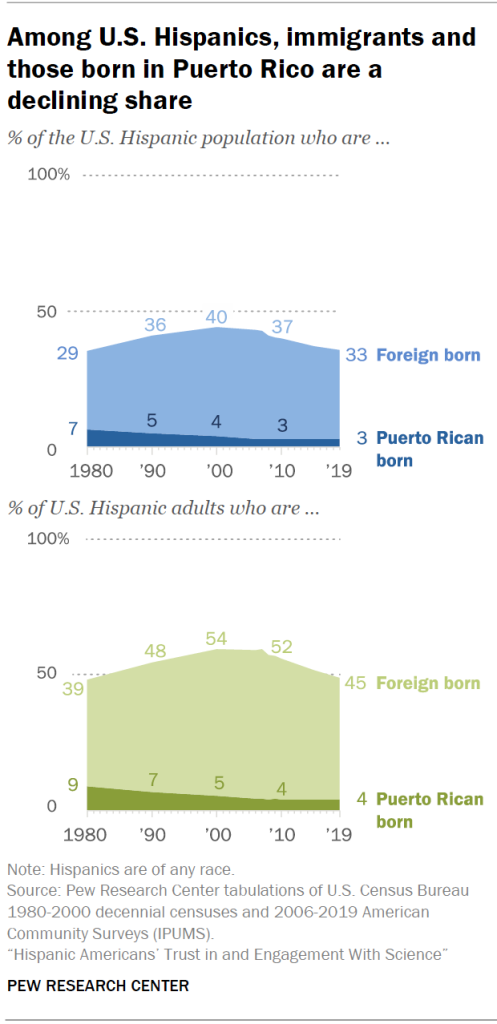
In 2019, about 19.8 million, or one-third, of all Latinos living in the U.S. were born outside the country, and an additional 1.9 million, or 3%, were born in Puerto Rico (those born in Puerto Rico are U.S. citizens at birth). Both groups have seen an increase in their population numbers since 2010. The number of Latino immigrants living in the U.S. was up from 19 million in 2010, and the number of Puerto Rican-born Latinos living in the U.S. was up from 1.5 million.
But, the share of U.S. Latinos born in another country peaked at 40% in 2000, and has declined since then, reflecting a slowdown in immigration from Latin America since then. Among Latino adults, the share born in another country stood at 44.8% in 2019, down from a peak of 55% in 2007.
The share of U.S. Latinos who were born in Puerto Rico is falling too, though it has rebounded some with increases in out-migration from the island following Hurricanes Maria and Irma in 2017. In 1960, the Puerto Rican-born share among U.S. Latinos peaked at 11%, but has since settled at around 3% since 2010.
Across Hispanic origin groups, the share born outside the U.S. varies widely. Venezuelans have the highest immigrant share, at 77%, followed by Paraguayans at 65% and Hondurans at 63%. But notably, across all groups except Venezuelans and Spaniards, the immigrant share has been in decline over the last decade as the Hispanic population becomes more settled.
At the same time, the number of Hispanics born in the U.S. has grown. Their share of the Hispanic population has risen too, from 59.9% in 2000 to 67.3% in 2019. This reflects the greater contribution to Hispanic population growth of births in the U.S. to Hispanic parents compared with the arrival of new immigrants, a trend that has become more pronounced in the last decade. Among adult Hispanics, the U.S.-born share increased, from its recent low of 45% in 2007 to 55.2% in 2019.
A growing share of Latinos are English proficient
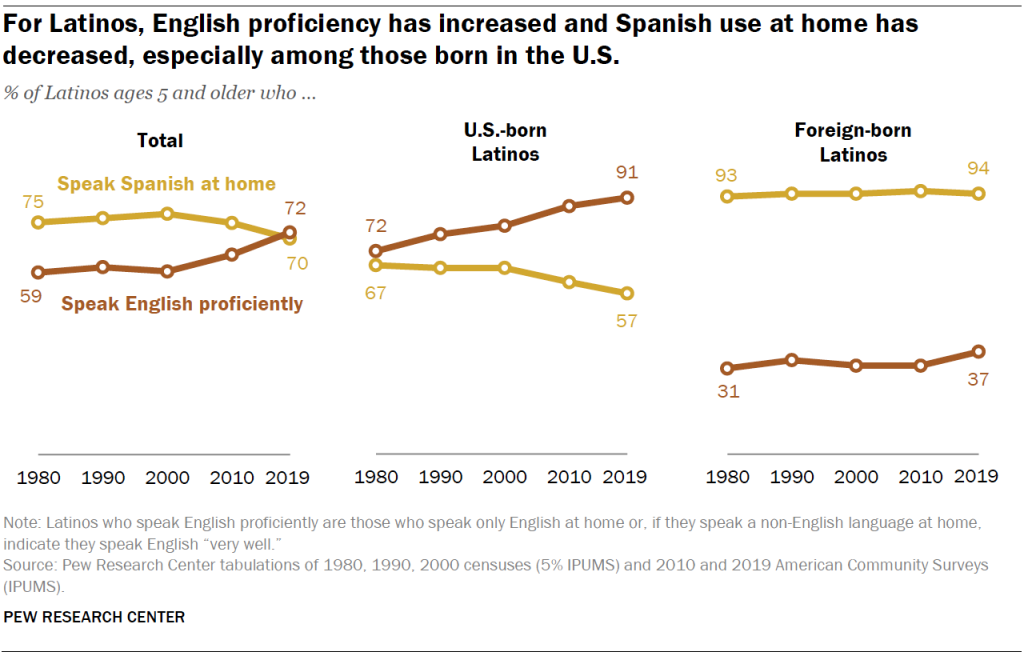
English proficiency is rising among U.S. Latinos. In 2019, the most recent available data from the U.S. Census Bureau, 72% of all Latinos ages 5 and older indicated they spoke English proficiently, up from 59% in 1980. Many of the gains in English proficiency for the group have come since 2000, reflecting the slowdown in Latin American immigration this century. At the same time, the share of Latinos who speak Spanish at home is falling. In 2019, seven-in-ten Latinos ages 5 and older spoke Spanish at home, down from a peak of 78% in 2000.
Changes in language use have been more pronounced among U.S.-born Hispanics. In 2019, 91% spoke English proficiently, up from 72% in 1980. Meanwhile, the share that speak Spanish at home fell, to 57% in 2019 from 67% in 1980. By contrast, changes in language use among Hispanic immigrants is mixed. English proficiency is up: In 2019, 37% spoke English proficiently, a jump from 31% in 1980. At the same time, Spanish use at home remains high: 94% of Hispanic immigrants spoke Spanish at home in 2019, about the same as in 1980.
See the Appendix for a profile of Hispanic adults in the survey sample.
‘Hispanic’ or ‘Latino’? It matters to some but about half don’t have a preference
The pan-ethnic labels Hispanic and Latino have been used over recent decades to describe the diverse population of 62.1 million people who trace their roots to Latin America or to Spain. Both labels have a long history in the U.S., and both have official government recognition. Hispanic has been officially in use since the 1970s, with Latino added in the 1990s. Organizations like Pew Research Center use the two terms interchangeably, as is done in this report.
While the two terms have official recognition and are broadly used, the population they are meant to describe is generally ambivalent about the two labels. For example, a 2018 Pew Research Center national, bilingual survey of this population asked which term respondents preferred to describe themselves. Roughly half (54%) indicated they had no preference for either, 27% preferred Hispanic and 18% preferred Latino. These results are little changed from 2002 when 53% indicated no preference, 34% preferred Hispanic and 13% preferred Latino.
Responses from focus group participants about these terms reflect this ambivalence. Some were open to either term, saying:
“I don’t have a preference. I’ve never actually thought of that question, but neither bother me, so I don’t really care.” – Hispanic woman, age 25-39
“I guess I don’t really prefer either. I’m okay with Latino or Hispanic.”– Hispanic man, 25-39
For other focus group participants, however, one label or the other is preferred. Some thought of themselves as Hispanic, saying,
“I consider myself a Hispanic.” – Hispanic woman, 40-65
“… I consider myself Hispanic. Or more Mexicana, because my parents were from Mexico.” – Hispanic woman, 40-65
For others, Latino is preferred:
“And I like to be called ‘Latina!’, with flavor!” – Hispanic woman, 40-65
“Latino, like the South Americans.” – Hispanic man, 40-65
More recently, a new pan-ethnic label has emerged in the U.S. – Latinx. It is a gender-neutral term meant to describe the population of people who trace their roots to Latin America. However, the term is largely unknown among the population it is meant to describe: 76% of Latino adults said they had not heard of Latinx, according to a Pew Research survey in 2019. And among all Latino adults, just 3% indicated they use it to describe their own identity.