The American Trends Panel survey methodology
The American Trends Panel (ATP), created by Pew Research Center, is a nationally representative panel of randomly selected U.S. adults. Panelists participate via self-administered web surveys. Panelists who do not have internet access at home are provided with a tablet and wireless internet connection. The panel is managed by Ipsos.
Data in this report are drawn from the panel wave conducted Jan. 7 to Jan. 21, 2019. A stratified random sample of 5,817 panelists was selected from the full panel. Of these, 4,464 panelists responded for a response rate of 77%. The subsample was selected by grouping panelists into five strata so demographic groups that are underrepresented in the panel had a higher probability of selection than overrepresented groups:
- Stratum A consists of panelists who are non-internet users. They were sampled at a rate of 100%.
- Stratum B consists of panelists with a high school or less education. They were sampled at a rate of 100%.
- Stratum C consists of panelists that are Hispanic, unregistered or non-volunteers. They were sampled at a rate of 54%.
- Stratum D consists of panelists that are black or 18 to 34 years old. They were sampled at a rate of 16%.
- Stratum E consists of the remaining panelists. They were sampled at a rate of 5%.
Panelists were grouped into these strata in hierarchical order from A to E. For example, a panelist who is not registered to vote and has a high school education or less would be in Stratum B rather than in Stratum C.
Accounting for nonresponse, the cumulative response rate to the recruitment surveys and attrition is 5.6%. The margin of sampling error for the full sample of 4,464 respondents is plus or minus 1.9 percentage points.
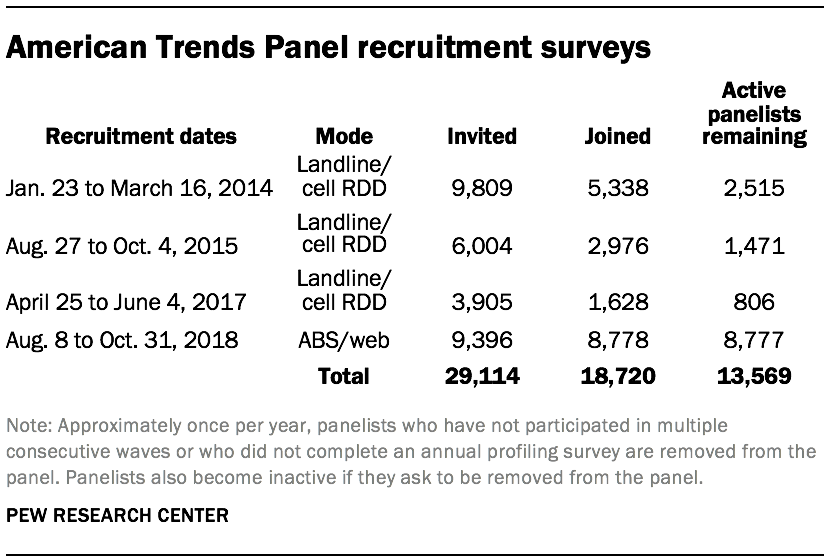
The ATP was created in 2014, with the first cohort of panelists invited to join the panel at the end of a large national landline and cellphone random-digit-dial survey that was conducted in both English and Spanish. Two additional recruitments were conducted using the same method in 2015 and 2017, respectively. Across these three surveys, a total of 19,718 adults were invited to join the ATP, of whom 9,942 agreed to participate.
In August 2018, the ATP switched from telephone to address-based recruitment. Invitations were sent to a random, address-based sample (ABS) of households selected from the U.S. Postal Service’s Delivery Sequence File. In each household, the adult with the next birthday was asked to go online to complete a survey, at the end of which they were invited to join the panel. For a random half-sample of invitations, households without internet access were instructed to return a postcard. These households were contacted by telephone and sent a tablet if they agreed to participate. A total of 9,396 were invited to join the panel, and 8,778 agreed to join the panel and completed an initial profile survey.
Of the 18,720 individuals who have ever joined the ATP, 13,569 remain active panelists and continue to receive survey invitations.
Weighting
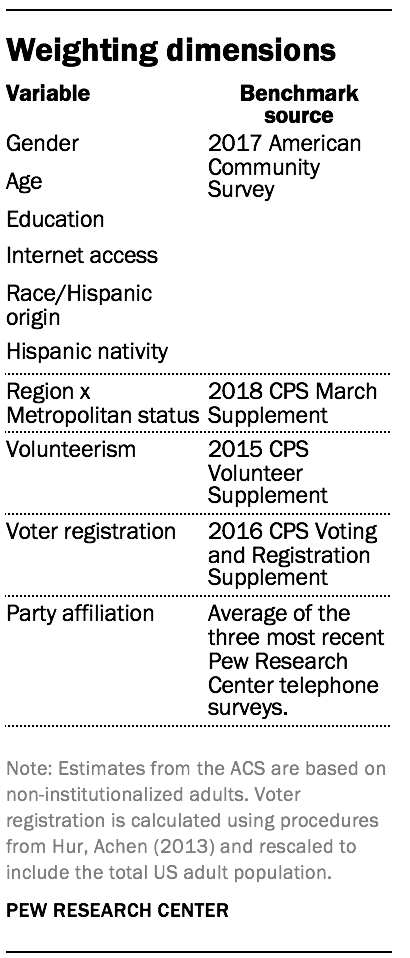
The ATP data were weighted in a multistep process that begins with a base weight incorporating the respondents’ original survey selection probability and the fact that in 2014 and 2017 some respondents were subsampled for invitation to the panel. The next step in the weighting uses an iterative technique that aligns the sample to population benchmarks on the dimensions listed in the accompanying table.
Sampling errors and statistical significance tests take into account the effect of weighting. Interviews are conducted in both English and Spanish, but the American Trends Panel’s Hispanic sample is predominantly U.S. born and English-speaking.
In addition to sampling error, one should bear in mind that question wording and practical difficulties in conducting surveys can introduce error or bias into the findings of opinion polls.
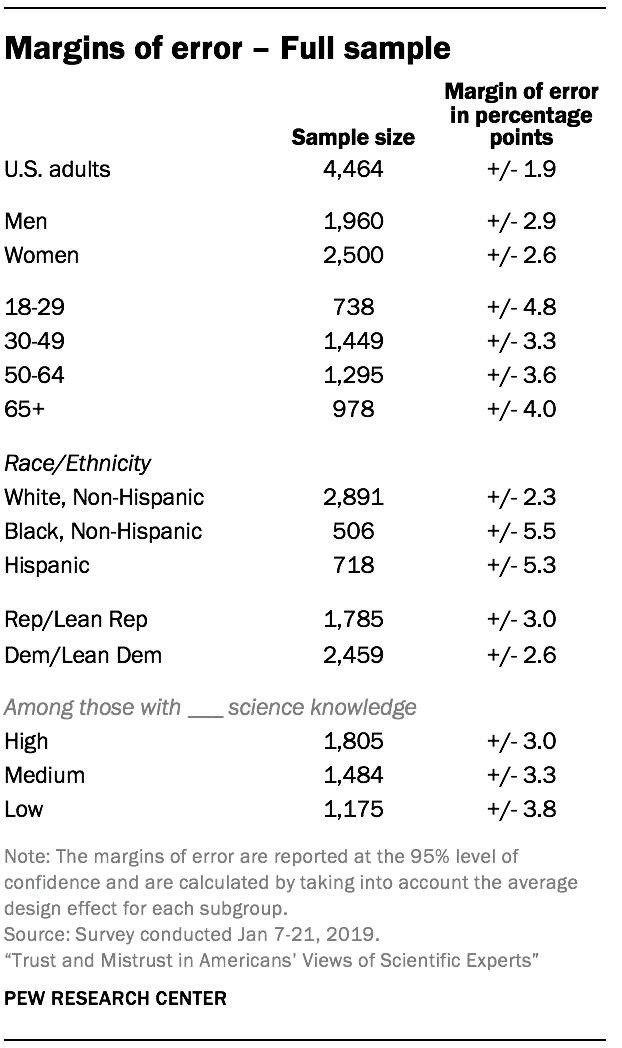
The margin of error for the full sample of 4,464 U.S. adults at the 95% level of confidence is plus or minus 1.9 percentage points. The following table shows the unweighted sample sizes and the error attributable to sampling that would be expected at the 95% level of confidence for different groups in the survey for the full sample.
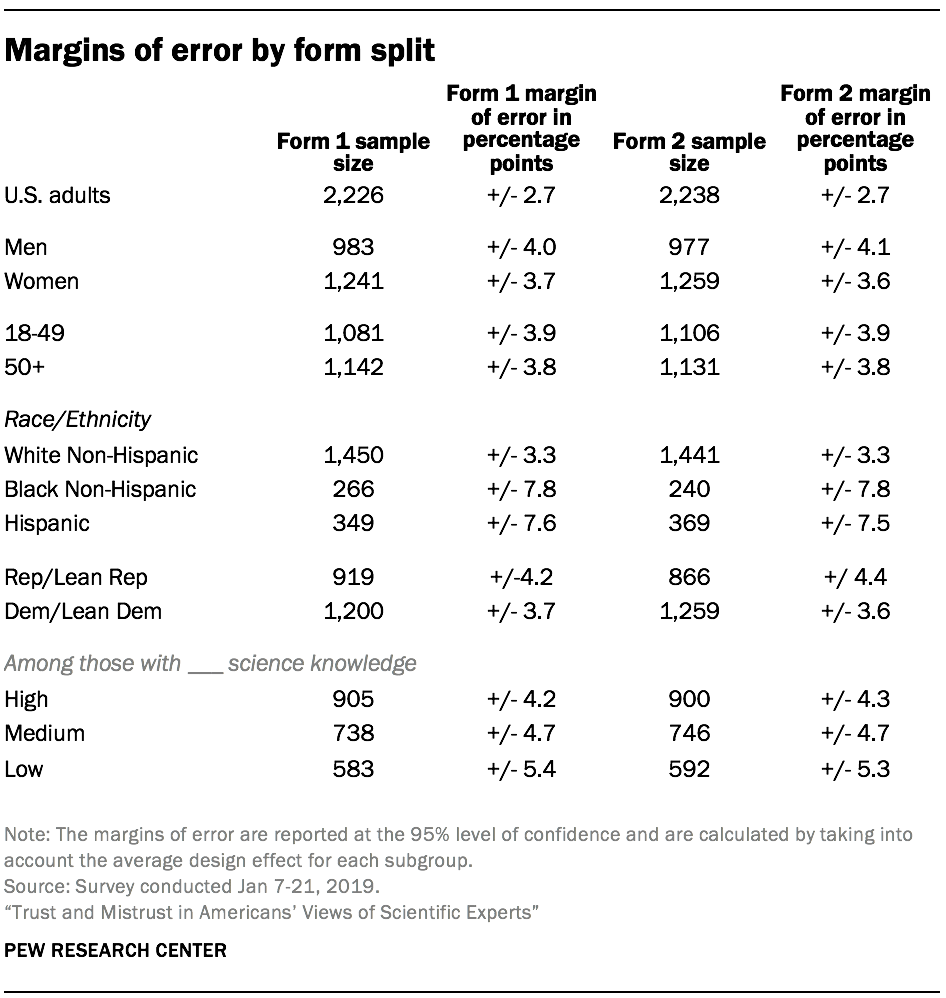
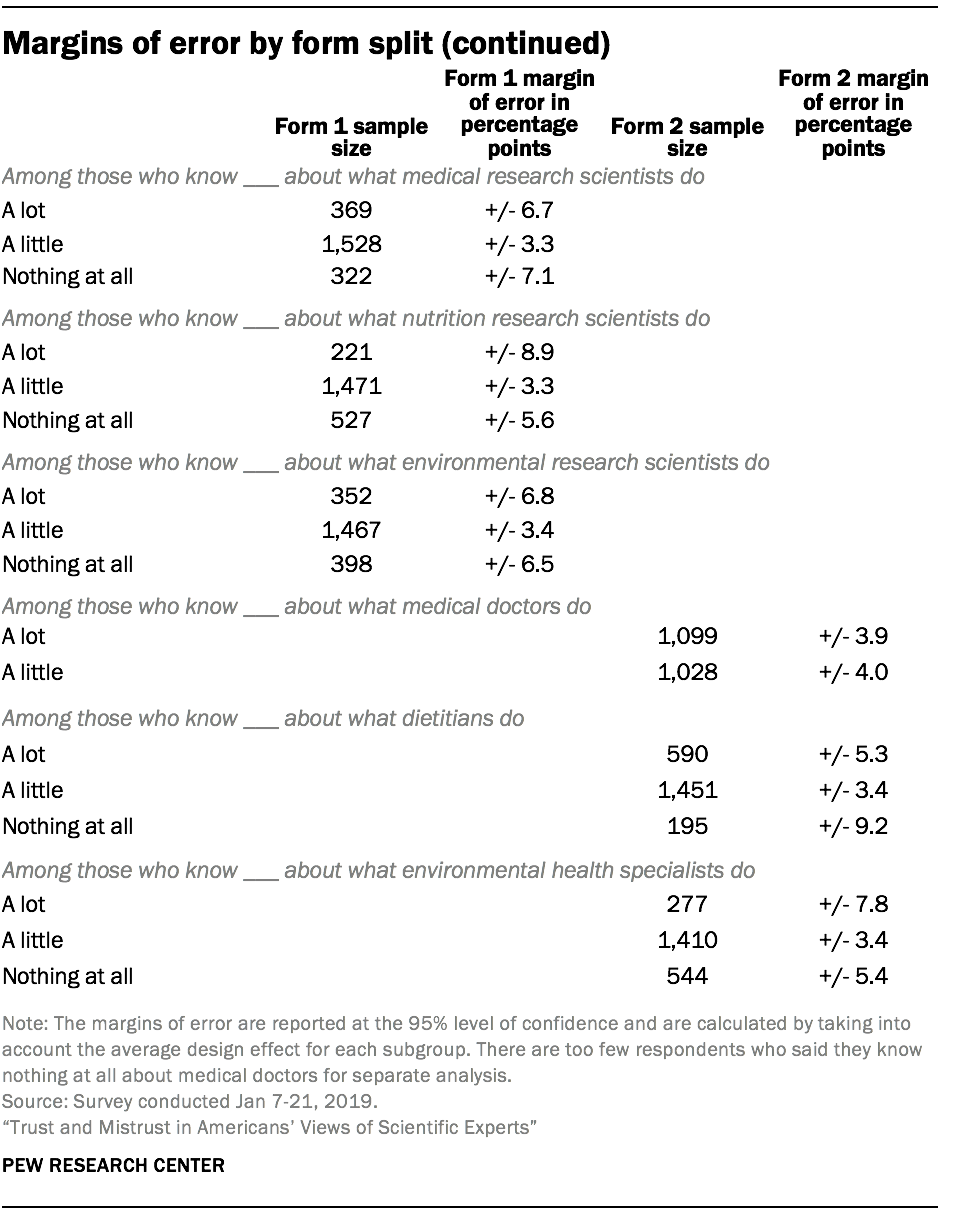
Respondents were also randomly assigned to complete one of two forms or sets of questions on the survey. The tables on the following pages show the unweighted sample sizes and the error attributable to sampling that would be expected at the 95% level of confidence for different groups for form 1 and form 2.
Sample sizes and sampling errors for other subgroups are available upon request.
Measurement properties of the science knowledge scale
Pew Research Center’s survey on science knowledge covers knowledge of facts connected with life sciences, earth and other physical sciences, numeracy and understanding of scientific processes.
The following criteria are used to evaluate how well the 11 items can used as a scale or index of science knowledge more broadly: 1) the degree to which responses are internally consistent 2) the degree to which the questions reflect a single underlying latent dimension, and 3) the degree to which the scale discriminates between people with high and low knowledge, providing information about people with varying levels of science knowledge.
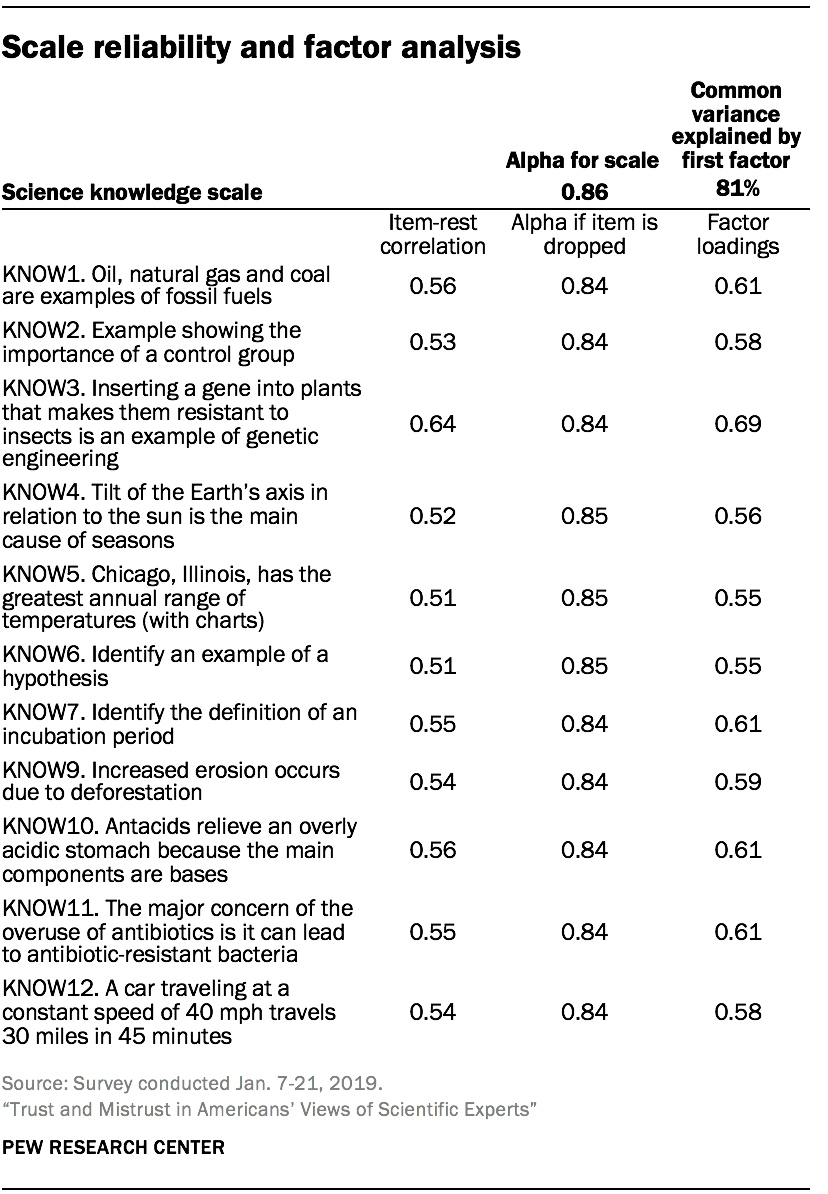
The internal reliability of the scale as measured by Cronbach’s alpha is 0.86. Cronbach’s alpha does not increase if any of the items are dropped.
An exploratory factor analysis finds that the first common factor explains 81% of the shared variance in the items. The second common factor explains only 9% of the common variance. The factor loadings show that each of the 11 items is at least moderately correlated with the first common factor. This suggests that the set of items is the result of a single underlying dimension.
Note that all the science knowledge items are coded as binary variables (either correct or incorrect). Both Cronbach’s alpha and factor analysis are based on a Pearson’s correlation matrix. Pearson’s correlations with binary variables are restricted to a limited range, underestimating the association between two variables. We do not anticipate the use of a Pearson’s correlation matrix will affect the unidimensional factor solution for the scale.
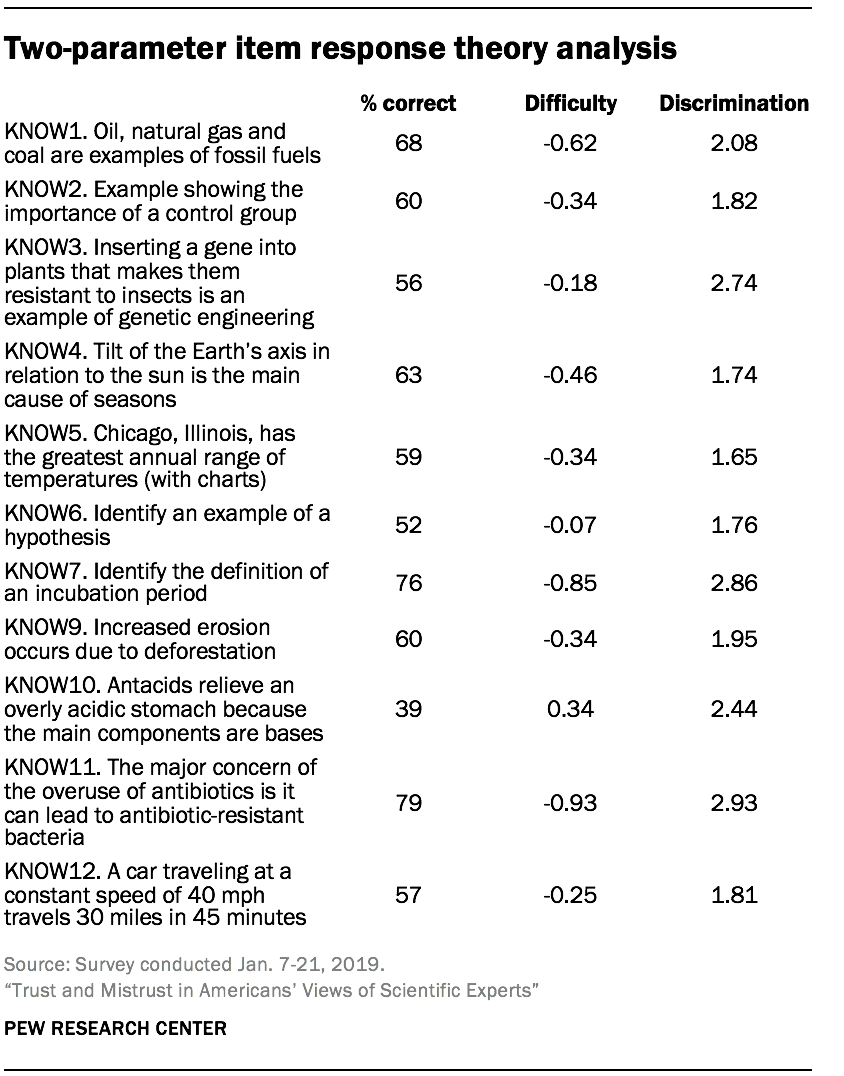
We conducted item response modeling for the scale to evaluate how well it discriminates between people at different levels of knowledge. The analysis fits a two-parameter logistic model, allowing discrimination and difficulty to vary across items.6 Discrimination shows the ability of the question to distinguish between those with higher and lower science knowledge. Difficulty shows how easy or hard each question is for the average respondent.
All the items have acceptable discrimination estimates. Two of the easiest items also have the two highest discrimination estimates: KNOW11 (the major concern of the overuse of antibiotics is it can lead to antibiotic-resistant bacteria) and KNOW7 (identify the definition of an incubation period). But one medium-difficulty item (KNOW3 – inserting a gene into plants that makes them resistant to insects is an example of genetic engineering) and one hard difficulty item (KNOW10 – antacids relieve an overly acidic stomach because the main components are bases) also have large discrimination estimates.
The difficulty parameter estimates are negative for 10 of the 11 items, and positive for one of the items. This shows that the average respondent had a good chance of getting the correct answer on most of the items.
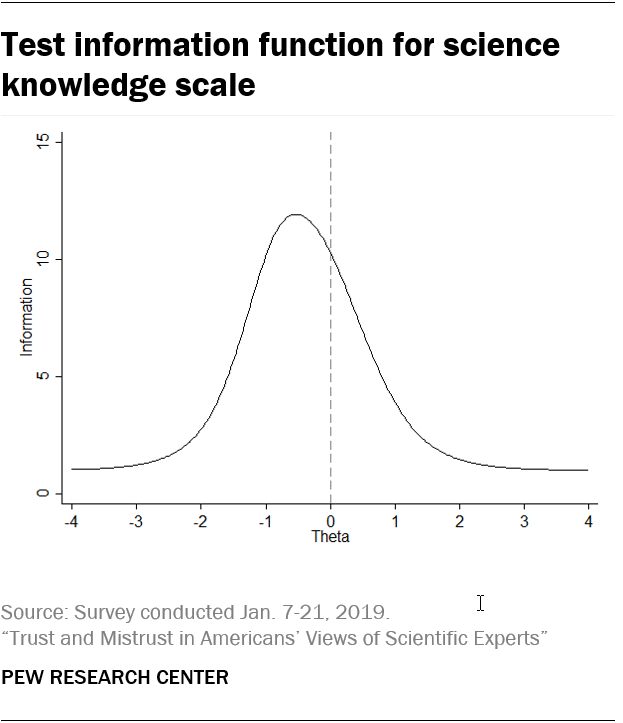
The test information function shows the amount of information the scale provides about people with different levels of science knowledge. The test function approximates a normal curve and is centered below zero (Theta) at about -0.5. This indicates that the scale provides the most information about those with slightly below-average science knowledge. The scale provides comparatively less information about those with high science knowledge, especially those with very high levels of knowledge.
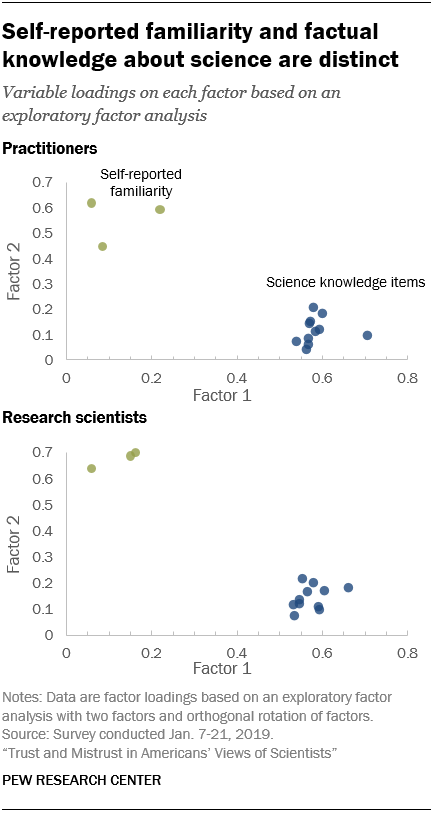
The Center’s survey finds that people’s self-reported familiarity with scientists is distinct from their factual science knowledge. Of the six measures of familiarity, the most highly correlated with the 11-item index of science knowledge are self-perceived familiarity with environmental researchers (r=0.31) and with medical doctors (r=0.30) and medical researchers (r=0.29).
An exploratory factor analysis finds a two-factor solution. One underlying factor is closely correlated with the factual science knowledge items and the second underlying factor is closely correlated with levels of familiarity with scientists. Such findings suggest the two measures are tapping different concepts.
© Pew Research Center, 2019