This report is drawn from a survey conducted as part of the American Trends Panel (ATP), a nationally representative panel of randomly selected U.S. adults recruited from landline and cellphone random-digit-dial (RDD) surveys. Panelists participate via monthly self-administered web surveys. Panelists who do not have internet access are provided with a tablet and wireless internet connection. The panel, which was created by Pew Research Center, is being managed by GfK.
Data in this report are drawn from the panel wave conducted April 23-May 6, 2018, among 2,537 respondents. The margin of sampling error for the full sample of 2,537 respondents is plus or minus 2.8 percentage points.
The second group of panelists was recruited from the 2015 Pew Research Center Survey on Government, conducted Aug. 27-Oct. 4, 2015. Of the 6,004 adults interviewed, all were invited to join the panel, and 2,976 agreed to participate.8 The third group of panelists was recruited from a survey conducted April 25 to June 4, 2017. Of the 5,012 adults interviewed in the survey or pretest, 3,905 were invited to take part in the panel and a total of 1,628 agreed to participate.9
The overall target population for Wave 34 was non-institutionalized persons ages 18 and older, living in the United States, including Alaska and Hawaii. The sample for Wave 34 consisted of 3,099 ATP members that were invited to Wave 33 and were still active. This subsample was selected using the following approach:
- Panelists were grouped into three strata based on how underrepresented they are demographically. Then we analyzed response rates to the last five panel survey waves (W28-32) to project the number of panelists in each stratum who would respond to the W33 survey.
- We then determined how many panelists we wanted to sample from each stratum in W33 in order to finish with around 2,500 completed interviews and have a responding sample that is as representative as possible.
- Stratum A consists of panelists who are non-internet users, are black non-Hispanic, are Hispanic, or have high school or less education. There were 1,819 total panelists in this stratum and they are sampled at a rate of 100% for W33. 1,806 were active panelists.
- Stratum B consists of panelists who are ages 18 to 34 or are non-volunteers. The 1,684 total panelists in this stratum are subsampled at a rate of 63%, yielding 1,061 sampled for W33 (1,057 were active).
- Stratum C consists of the remaining 2,009 panelists not in stratum A or B. This group is subsampled at a rate of 12%, yielding 241 panelists sampled for W33 (239 were active).
The ATP data were weighted in a multistep process that begins with a base weight incorporating the respondents’ original survey selection probability and the fact that in 2014 some panelists were subsampled for invitation to the panel. Next, an adjustment was made for the fact that the propensity to join the panel and remain an active panelist varied across different groups in the sample.
The final step in the weighting uses an iterative technique that aligns the sample to population benchmarks on a number of dimensions. Gender, age, education, race, Hispanic origin and region parameters come from the U.S. Census Bureau’s 2016 American Community Survey. The county-level population density parameter (deciles) comes from the 2010 U.S. decennial census. The telephone service benchmark comes from the July-December 2016 National Health Interview Survey and is projected to 2017. The volunteerism benchmark comes from the 2015 Current Population Survey Volunteer Supplement. The party affiliation benchmark is the average of the three most recent Pew Research Center general public telephone surveys. The internet access benchmark comes from the 2017 ATP Panel Refresh Survey. Respondents who did not previously have internet access are treated as not having internet access for weighting purposes.
Sampling errors and statistical tests of significance take into account the effect of weighting. Interviews are conducted in both English and Spanish, but the Hispanic sample in the ATP is predominantly U.S. born and English speaking.
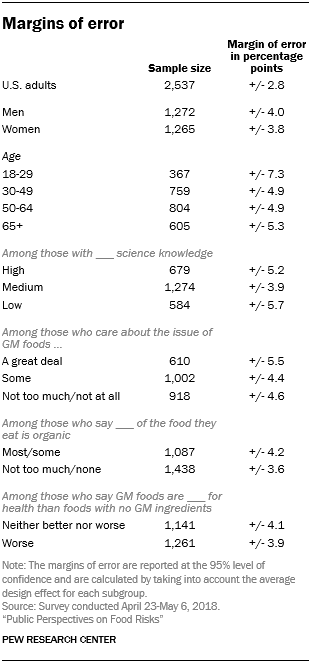
Margins of error tables shown here provide the unweighted sample sizes and the error attributable to sampling that would be expected at the 95% level of confidence for different groups in the survey, taking into account the average design effect for each subgroup. Sample sizes and sampling errors for other subgroups are available upon request.
In addition to sampling error, one should bear in mind that question wording and practical difficulties in conducting surveys can introduce error or bias into the findings of opinion polls.
The April 2018 wave had a response rate of 82% (2,537 responses among 3,099 individuals in the panel). Taking account of the combined, weighted response rate for the recruitment surveys (10.1%) and attrition from panel members who were removed at their request or for inactivity, the cumulative response rate for the wave is 2.3%.10
Science knowledge index
The Pew Research Center survey included a set of nine questions to tap public knowledge of science across a range of principles and topics. Most respondents (n=1,901) completed these questions as part of a previous wave of the American Trends Panel, conducted May 10-June 6, 2016. Respondents who did not participate in the previous wave answered these questions in this survey (n=636). The following shows the measurement properties of the index for the combined set of 2,537 respondents.11
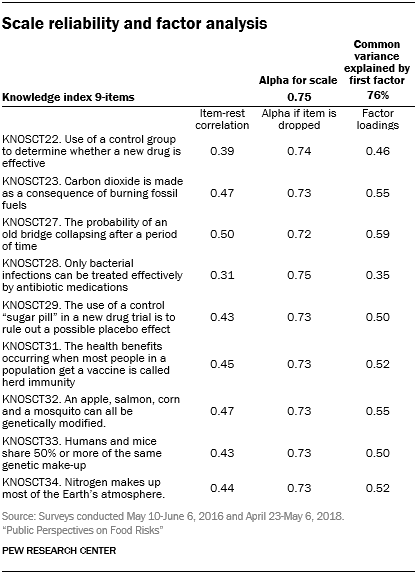
As shown in the accompanying table, the internal reliability or consistency of the scale as measured by Cronbach’s alpha is 0.75. Each of the items in the scale is at least moderately correlated with the other items.
An exploratory factor analysis finds one common factor explaining 76% of the common variance in the items. The factor loadings show that each of the nine questions is moderately correlated with the common factor. These indicators suggest a set of items is measuring a single underlying dimension.
Note that each of the science knowledge questions are coded as binary variables (correct/incorrect). Both Cronbach’s alpha reliability analysis and the factor analysis are based on a Pearson’s correlation matrix. Pearson correlations with binary variables are restricted to a limited range, underestimating the association between two variables when compared with tetrachoric correlations. We do not anticipate that the use of a Pearson’s correlation matrix affects the unidimensional factor solution for the scale, however.
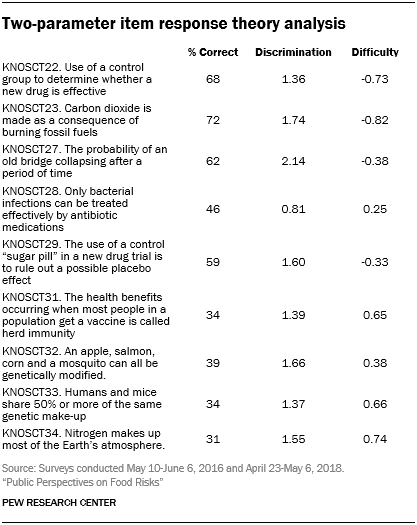
We also ran an item-response theory analysis (IRT) to check how well each question distinguishes between those who know relatively more or less on the scale. This analysis fits a two-parameter logistic model, allowing discrimination and difficulty to vary across the items. Discrimination shows the ability of the question to distinguish between those with higher and lower science knowledge. Difficulty shows how easy or hard each question is for the average respondent. We did not include a guessing parameter in the model; the questionnaire offered respondents an explicit option of not sure on the survey.
The results show variation in difficulty across the items. The easiest item required respondents to identify that carbon dioxide as the gas that is made as a consequence of burning fossil fuels, while the most difficult item required respondents to identify nitrogen as the gas that makes up most of the Earth’s atmosphere.
Most of the questions also discriminate between those with higher and lower science knowledge. The item with strongest ability to discriminate was the question asking respondents to calculate the conditional probability of an old bridge over time. The question with the weakest ability to discriminate is that effectiveness of antibiotics to treat bacterial, but not other kinds of infections.
The test information curve mirrors a normal curve centered around zero, suggesting that the science knowledge index provides the most information about Americans near the mean level of knowledge.
© Pew Research Center, 2018

