Our 2010 estimates of the size of religious groups differ from the 2010 estimates we published in previous reports, including “The Global Religious Landscape” (2012), “The Future of World Religions: Population Growth Projections, 2010-2050” (2015) and “The Changing Global Religious Landscape” (2017).
We revised estimates for 2010 to reflect advances in our methodology, including new approaches to measuring religion in China and categorizing adherents of folk religions. Furthermore, this report draws on data sources that were not available to us previously. We made these revisions to improve the validity of 2010 figures, and so that the measures presented within this report could be directly compared with each other – i.e., to ensure that we use the same types of measures consistently across time periods and countries.
We describe the new 2010 figures as methodological revisions to avoid confusion with the societal changes we estimate took place in each country between 2010 and 2020.
How do our 2010 global estimates differ from what we published before?
As a result of our methodological revisions, our current 2010 estimates for a few groups are substantially different from our initial 2010 estimates.
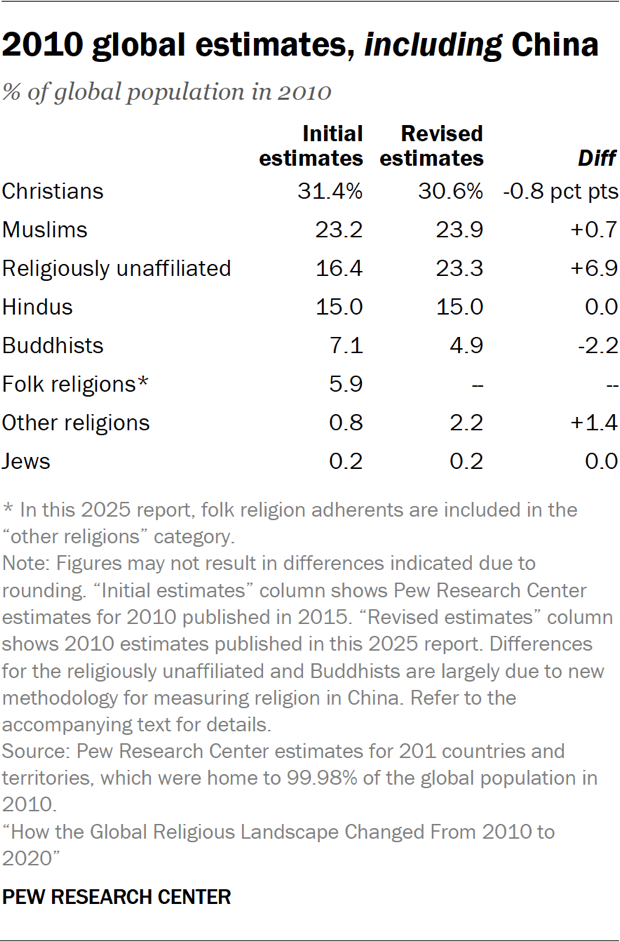
In percentage points, the difference is largest for the religiously unaffiliated population, which we now estimate was 23% of the global population in 2010, instead of 16% in our previous estimates.
We no longer make a separate estimate for the number of people who identify with folk religions. Instead, people who identify with folk religions in censuses and surveys have been counted in our “other religions” category, which makes up 2% of our revised global religious landscape, up from 1% in our earlier reports.
Among the remaining categories, the largest downward revision in percentage point terms is for Buddhists, who we now estimate made up 5% of the global population in 2010, instead of 7% in our previous estimates.
As a result of country-level revisions, global shares of Christians and Muslims have moved by less than 1 percentage point. Our revised Christian estimate for 2010 is 31% of the world’s population, and our revised Muslim estimate is 24%. Our estimates of the share of Hindus and Jews in the world have undergone very small revisions in the new report.
The revisions to our estimates of the world’s religiously unaffiliated, Buddhist and Christian populations are largely due to our new approach to measuring religion in China. Revisions to the Muslim estimates are largely due to updated source data from Nigeria, and updated United Nations figures for Pakistan’s overall population.31
Our new approach to measuring religion in China
In most countries, the adjustments we made to our methodology have resulted in only modest changes. But in China, a new approach has resulted in consequential revisions for that country and – because China accounts for a large share of the global population – for the rest of the world.

Our initial estimates for China, first published in 2012, were based on a mix of identity, belief and practice measures drawn from a 2007 Spiritual Life Study of Chinese Residents survey. Using this mix of measures, we originally classified 52% of Chinese people as having no religious affiliation. In our revised estimates, to be consistent with our approach in other countries, we use only a single measure of religious identity. Based on responses to the question, “What is your religion” – typically using the Chinese word zongjiao for religion – we now estimate that 87% of people in China did not formally identify with a religion in 2010.32
Zongjiao versus measures of belief and practice in China
Assessing how many people in China identify with religion is difficult, as we discussed in our 2023 report “Measuring Religion in China.”

The challenges of measuring religion in China are conceptual, cultural and political. Chinese surveys that ask about religious identity typically use the Chinese term zongjiao (宗教), which is commonly understood as a form of organized religion. Chinese people generally do not use this term to describe popular rituals, such as making offerings to deities. Meanwhile, unlike Christianity and Islam, Chinese traditional religions are often deeply intertwined and do not emphasize exclusive membership.
As a result, surveys that ask about zongjiao identity may not capture people who venerate Buddha and other deities but who do not consider themselves to be affiliated with a religion. An analysis we conducted in 2023 indicates that the questions about zongjiao affiliation tend to capture people who are actively engaged in religious beliefs and practices.
Additionally, surveys may suffer from underreporting because some Chinese people may be motivated to conceal their zongjiao identity in light of China’s policies on religion.
To address these challenges, our 2015 estimates used a distinct mix of methods. For instance, we derived our Buddhist estimate (18%) from a survey question that asked respondents whether they believe in “Buddhism or Buddha” instead of just “Buddhism.”33 To account for possible underreporting of Christian identity, we adjusted our Christian estimate up from the survey’s reported level of Christian identity.34
While these strategies were intended to provide an accurate snapshot of China’s religious landscape as of 2010, they made our China estimates less comparable with our estimates for other countries.
Furthermore, our earlier strategy was not well suited for measuring change in China between 2010 and 2020. For example, while surveys may tend to undercount Christians (or other groups), we don’t know whether potential undercounts are growing, shrinking or stable in magnitude. We have discussed this topic at length elsewhere.35
In this report, we rely on measures of religious identity (i.e., zongjiao identity) to estimate China’s religious landscape.
Researchers have found that zongjiao measures produce consistent estimates across surveys, and zongjiao identification patterns remain stable amidst a shifting political climate for religion. Focusing on zongjiao measures allows us to compare the sizes of China’s religious groups with those of other countries and assess how these sizes have changed over time.36
The adjustments we made in China account for most of the differences in our global numbers of Buddhists, Christians and religiously unaffiliated people. Adjusting our China estimate was less consequential for global estimates of Muslims, Hindus and Jews, because these groups are not as heavily represented in China in proportion to their global populations.
Our new approach to folk religions
People who practice folk religions aren’t consistently captured in surveys and censuses. Sometimes, appropriate response categories are missing or underutilized. And sometimes, people who practice folk religions also follow another religion, such as Christianity or Islam, which they report in surveys.
In our initial estimates, we had a separate category for people who practice folk or traditional religions, and when we suspected that folk religion populations may have been undercounted, we adjusted estimates of the size of those populations using data from the World Religion Database and other sources.
In the current analysis, we include people who identify with folk religions in the “other religions” category, and we no longer attempt to make an adjustment for possible undercounts.
Maximizing comparability of sources and methods
An important goal for all the estimates in this report is that the 2010 and 2020 estimates of the religious makeup of each country should be as directly comparable as possible.
More people generally volunteer some kind of religious identity when they are asked a single, direct question (such as, “What is your religion, if any?”) rather than a two-step question, such as, “Do you have a religion?” followed – if the answer was “yes” – by, “What is it?” The two-step format tends to filter out some people with lower levels of religious belief and practice.37 We generally rely on data sources that measure religious identity with a direct, one-step question. But in some countries, we chose to rely on a two-step question when it was the most comparable option available in data sources for both 2010 and 2020. If we used different types of questions in those two years, we would be less able to discern real change over time: Any apparent difference between the 2010 and 2020 results might be a consequence just of the differently worded questions.
To maximize comparability over time, our revised estimates no longer make adjustments for possible underreporting of identities, such as adherents of folk religions or Christians in China and India.
Years ago, when we were compiling data and making estimates of each country’s religious composition for our earlier reports, we were focused on describing the size of groups in just one year, 2010. Adjusting for possible undercounts among adherents of folk religions and a few other groups in a few places seemed fitting. We expected that conservative adjustments would improve the accuracy of our estimates. However, we did not – and do not – have reliable information about how large the possible undercounts were. Nor do we know how they might be changing over time. For this report, we chose to forego all such adjustments.
Other revisions to our 2010 estimates
In addition to revising our approach in China and recategorizing adherents of folk religions, we made a few other methodological changes that affect our 2010 estimates.
Changes to our data sources
Many of the 2010 estimates in this report use a different source than we used before. In some cases, our current source was not previously available to us. In other cases, we chose a past source (for 2010) that is more comparable with the best source now available to measure religion in 2020. These revisions introduced changes big and small at the country level, which partially offset each other. In 10 countries, we adjusted our estimate of the majority religion. For example, we now estimate that Nigeria had a Muslim majority in 2010 rather than a Christian plurality that year. And we estimate that Vietnam had a religiously unaffiliated majority rather than a plurality of adherents of folk religions.
Changes to include children in population estimates
Few surveys include measures of the religion of children, so general population estimates in our past reports were in many cases based on the religious composition of adults. For this report, we estimate the religious composition of children in each country and use those figures in improving the accuracy of our 2010 and 2020 general population estimates.
In addition to the consequential methodological revisions described above, we also made smaller tweaks to our 2010 methodology that had little impact on the results:
Changes to exclude less-populous countries and territories
This report focuses on 201 countries and territories that are home to 99.98% of the world’s people. Our earlier reports included additional places that had populations below 100,000 in both 2010 and 2020.38 There is often very little data on religion available for these less populous countries. Because of their size, the omission of these places has little impact on global estimates of religious composition.
Changes to UN data
Our earlier reports used 2010 country-level population estimates from the United Nations’ 2010 revision of the World Population Prospects. This report uses 2010 estimates from the UN’s updated 2024 revision. There are many modest population differences between revisions of the UN data, which have minor effects on how the religious composition of each country is weighted. The largest differences are increases of at least 10 million people in the 2010 populations of Pakistan, India and China.


