Pew Research Center analyzed data on six religious groups – Christians, Muslims, Hindus, Buddhists, Jews and people with no religious affiliation.37
Globally, the average Muslim lives in the biggest household (6.4 people), followed by the average Hindu (5.7), Christian (4.5), Buddhist (3.9), “none” (3.7) and Jew (3.7). Religious groups also vary in the types of households they are most likely to occupy: Hindus, Buddhists and the religiously unaffiliated most often reside in extended families, while Muslims, Christians and Jews have larger shares in two-parent homes.
But religious groups are not monolithic, and followers of the same religion living in different parts of the world often vary substantially from each other. The experiences of religious groups are sometimes closely tied to the patterns found in the regions where they reside.
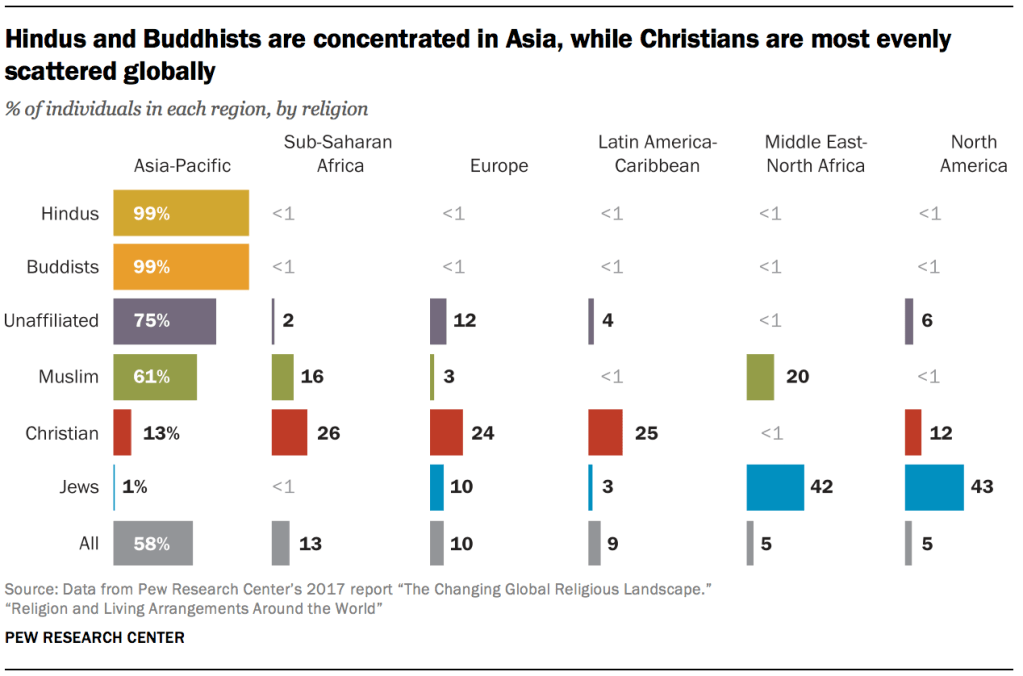
Religious groups also are distributed unevenly around the world. Christians are the most evenly scattered, with no more than a quarter living in any one region. The majority of Muslims, meanwhile, live in the Asia-Pacific region, but there are also large Muslim populations in the Middle East-North Africa and sub-Saharan Africa regions. Most of the world’s religiously unaffiliated people and even larger shares of all Buddhists and Hindus live in Asia, while Jews are concentrated in Israel and the United States.
This report does not attempt to determine exactly how religion shapes household patterns. It is difficult to quantify the extent to which religion, on its own, affects people’s living arrangements – or conversely, how a person’s home life influences their religious affiliation. Still, comparing a single religious group in a country or region to the rest of the population may help illuminate possible connections between living arrangements and religion.
This chapter examines each religious group separately and explores not only how the experiences of each group’s adherents vary from region to region, but also how their experiences compare with those of people who are not of that religion.
Information is provided on religious groups within regions when there are sufficient survey data to represent at least one-third of that group’s regional population and when that group has at least 500,000 adherents in that region. For example, enough Buddhists were surveyed in the Latin America-Caribbean region to represent 61% of the regional population – surpassing the one-third cutoff. However, only about 430,000 of the world’s 499 million Buddhists (about one-tenth of 1%) live in the region, so figures for Latin American Buddhists were not presented. See the Methodology for more details.
The analysis of religious groups is presented in descending order of the groups’ size, starting with Christians, who make up the world’s largest religion.
Christians
Christians account for nearly a third of the global population, making them the largest of the major religious groups. They also are the most broadly distributed, with roughly equal percentages living in Europe (24%), Latin America and the Caribbean (25%) and sub-Saharan Africa (26%). The Asia-Pacific region and North America together account for most of the remaining quarter; the share of Christians who reside in the Middle East-North Africa region is less than 1%.
In terms of their shares of the regional populations, Christians represent majorities in Latin America and the Caribbean (90%), North America (76%), Europe (73%) and sub-Saharan Africa (62%), and small minorities in the Asia-Pacific region (7%) and the Middle East and North Africa (4%).
Christians: Household size
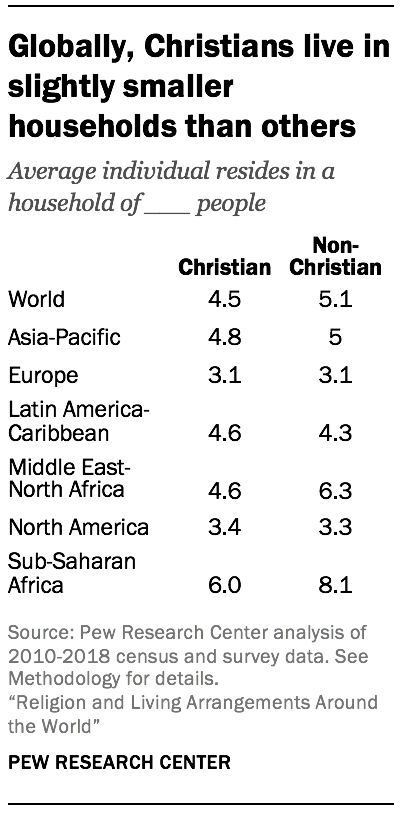
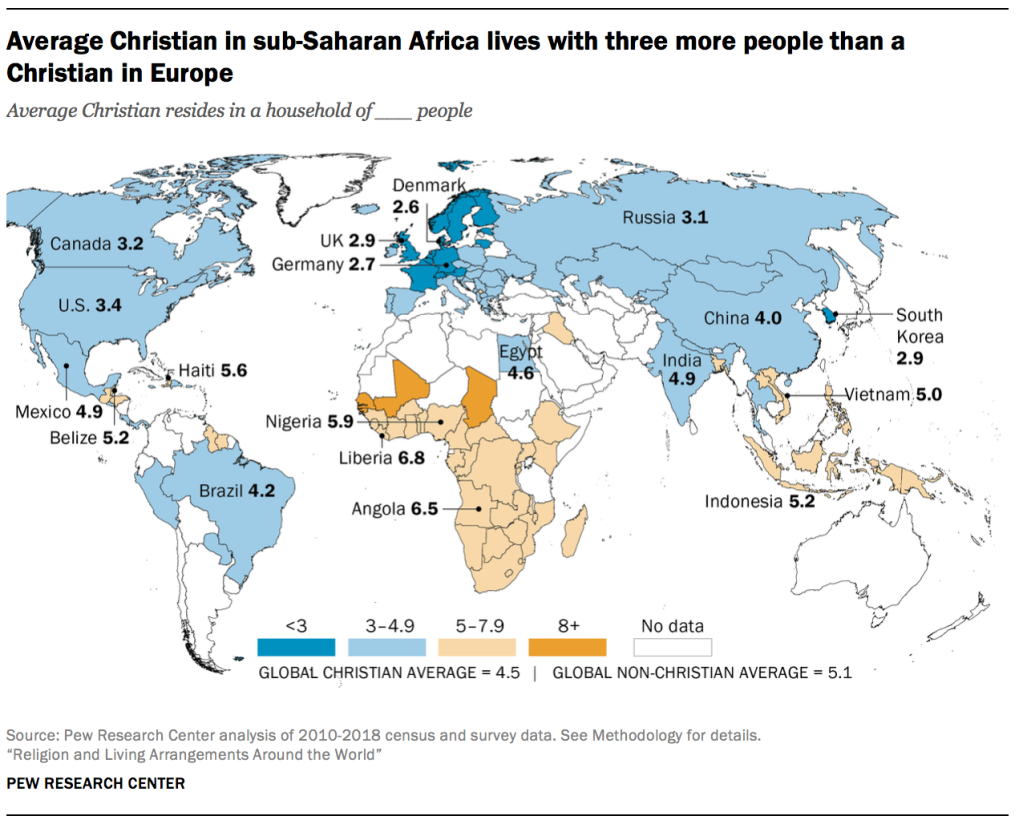
Globally, Christians are the largest group in 12 of the 15 countries with the smallest households. Christians around the world live in somewhat smaller households, on average, than non-Christians (4.5 vs. 5.1 members). Christians have their smallest households in North America (3.4) and Europe (3.1), and – by a wide margin – their largest households in sub-Saharan Africa (6.0). Christians live with the largest number of people in Gambia, where their households contain 10.3 people, on average. And Christians’ smallest households are in Denmark and Sweden, both with an average of 2.6 people.
The tendency of Christians to live in smaller households than others is particularly pronounced in areas where they live alongside Muslims: In sub-Saharan Africa and the Middle East-North Africa region, Christians have households with roughly two fewer people than non-Christians, on average. In other parts of the world, the gaps between Christians and others are much smaller.
Christians: Household types
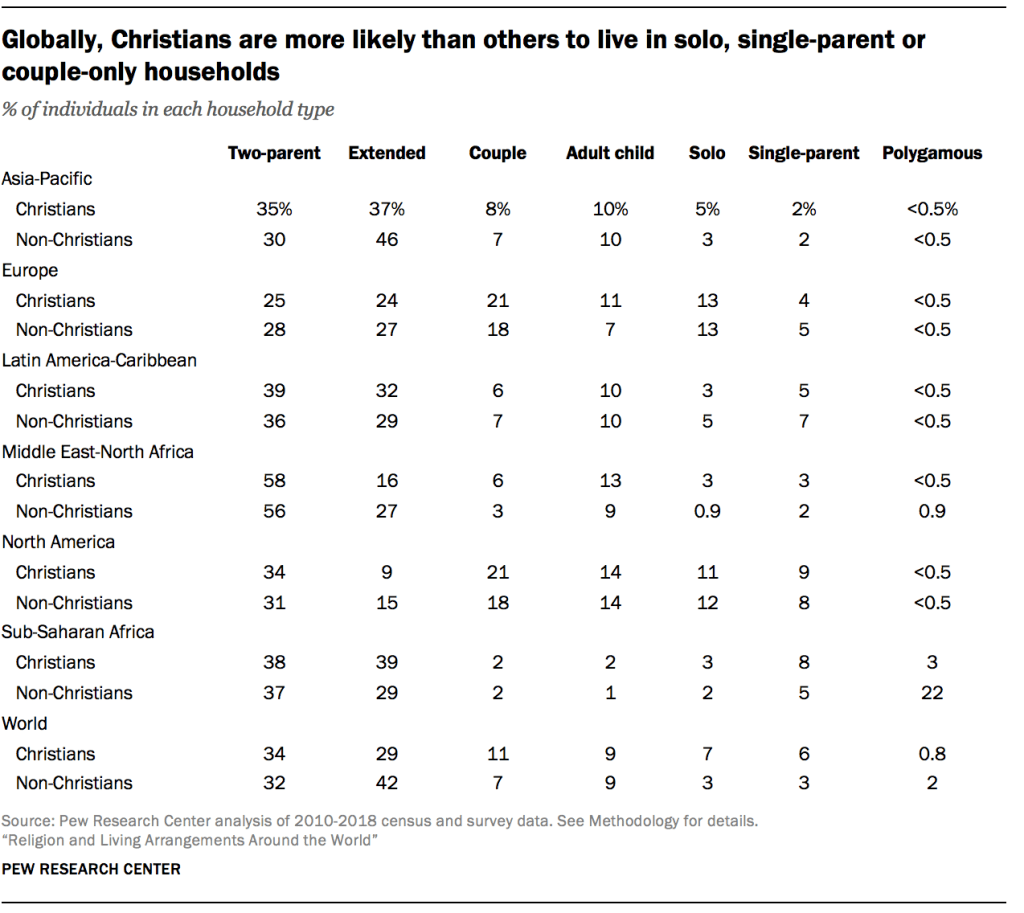
Christians around the world are most likely to live in two-parent families with minor children, and they do so at about the same rate as everyone else (34% vs. 32%). But Christians are markedly less likely than others to live in extended families (29% vs. 42%). In fact, Christians are the least likely group – aside from Jews (17%) – to live with a wider circle of relatives.

On the other hand, Christians are more likely than non-Christians to live in household types that have few members: Larger shares of Christians live alone (7% vs. 3%) or as couples without other family members (11% vs. 7%). In some countries, such as Sweden (35%) and Germany (32%), living in a couple-only household is the most common arrangement for Christians.
Globally, Christians also are more likely than non-Christians to live in single-parent households (6% vs. 3%), a type of arrangement that is generally more common in North America, sub-Saharan Africa and Latin America – all Christian-majority regions. Within these regions, Christians live in single-parent families at close to the same rates as non-Christians.
In the Asia-Pacific, Latin America-Caribbean, Middle East-North Africa and sub-Saharan Africa regions, Christians overwhelmingly live in extended or two-parent families, with combined shares of more than 70%. Far fewer European Christians (49%) and North American Christians (43%) reside in those types of households, and they are more likely than Christians elsewhere to live alone (13% and 11%, respectively) or as a couple (21% in both regions).
Muslims
About a quarter of all people are Muslims, making them the world’s second-largest religious group (and the fastest-growing major group). Over six-in-ten Muslims – about a billion – live in the Asia-Pacific region, and most other Muslims live in the Middle East-North Africa (20%) or sub-Saharan Africa (16%) regions.
Muslims represent more than nine-in-ten people in the Middle East and North Africa, about three-in-ten sub-Saharan Africans and a quarter of the population in the Asia-Pacific region. Elsewhere, Muslims are small minorities, accounting for 6% of the population in Europe, 1% in North America and a statistically negligible fraction in Latin America.38
Muslims: Household size
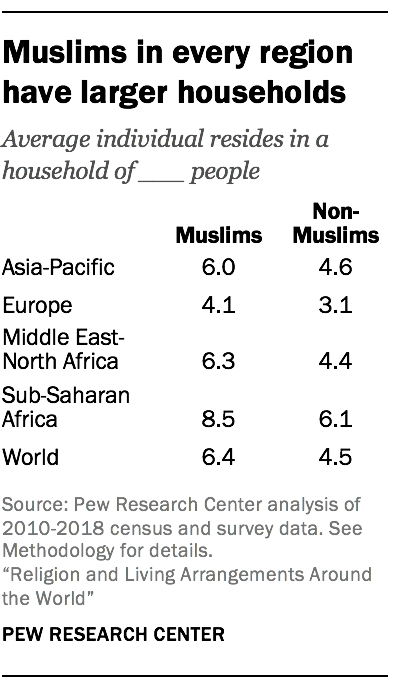
Globally, in the 15 countries with the biggest households, Islam is the largest religion in all but one – Benin. Muslims around the world live in households with an average of approximately two more people than non-Muslims (6.4 vs. 4.5), and they reside in larger families than non-Muslims in every region analyzed.
One reason Muslims live in larger households is that they tend to have more children compared with other religious groups. Muslims around the world also are relatively young; in a handful of Muslim-majority countries, half or more of the population is under 18, and children are unlikely to live alone or in a couple-only arrangement.
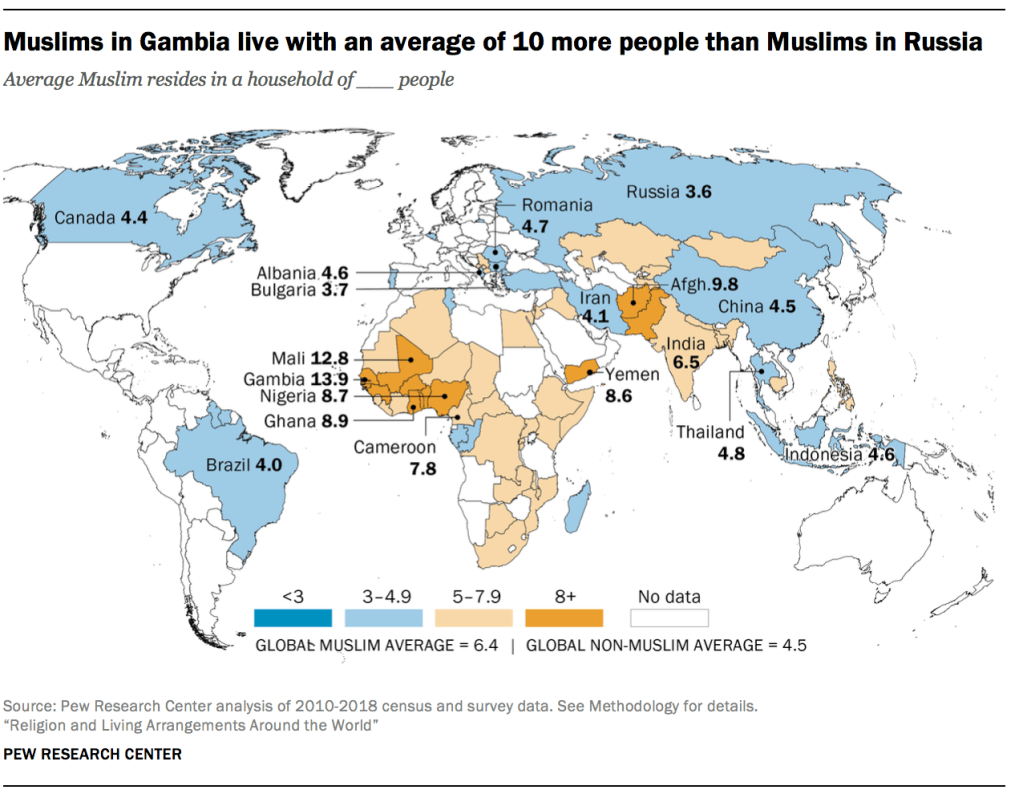
In sub-Saharan Africa, Muslims have their biggest households (8.5 people, on average) and also the widest gap in size compared with non-Muslims (6.1). The biggest households identified in this study belong to Muslims in Gambia (13.9), Senegal (13.6) and Mali (12.8) – all countries that have high rates of polygamy (see Chapter 1).
Like other religious groups, Muslims have their smallest households in Europe. Still, in European countries with enough representation to compare Muslims with others, the average Muslim lives with more people than the average non-Muslim.
The opposite is true in the country with the world’s largest Muslim population: In Indonesia, Muslims live in households with an average of 4.6 members, while non-Muslims (who are mostly Christian) live in households of 5.1 people, on average.
Muslims: Household types
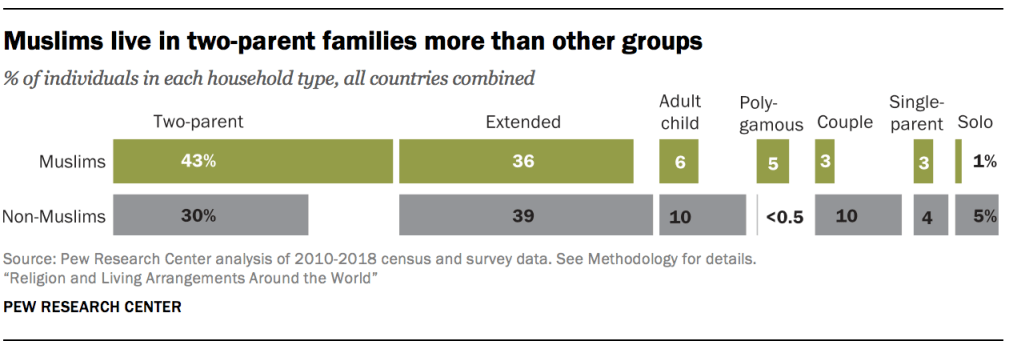
Muslims are less likely than others to live in households that contain no children or extended family. Only about 5% of Muslims live either alone or as a couple without children, compared with about 15% of non-Muslims. And Muslims are much more likely than others to live in two-parent homes with minor children (43% vs. 30%).
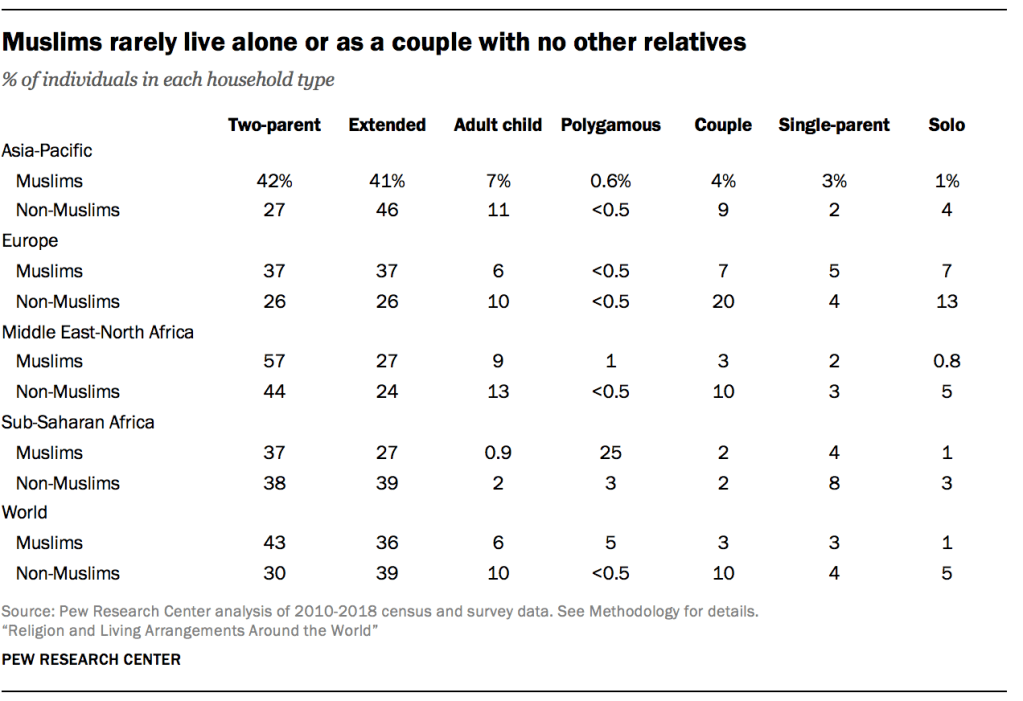
Within regions, Muslims often differ from non-Muslims. In Asia and the Pacific, for example, four-in-ten Muslims live in two-parent homes, compared with three-in-ten non-Muslims. In Europe, Muslims are notably more likely than others to live in two-parent or extended-family households, and they are much less likely than non-Muslims to live in couple-only households (7% vs. 20%).
In sub-Saharan Africa, Muslims live in extended-family households less frequently than others (27% vs. 39%). Conversely, Muslims are much more likely than others in this region to reside in polygamous homes (25% vs. 3%). (For more about polygamy in sub-Saharan Africa, see here.)
Muslims are unique in their relatively large share of adherents living in polygamous households. Worldwide, in the countries studied, about 5% of Muslims live in this type of arrangement, which means that more Muslims live in polygamous households than live in solo, single-parent or couple-only households. This estimate may even be conservative because suitable data was not available from some Muslim-majority Persian Gulf countries where polygamy is legal and assumed to be common.39
Religiously unaffiliated
Like Christians, Muslims and other groups, the religiously unaffiliated have an array of identities and beliefs. Atheists, agnostics and people who do not identify with any religious group are all classified as unaffiliated.
While the term “nones” has become widely accepted as shorthand for the religiously unaffiliated, this category also includes people who consider themselves religious and hold a mix of religious beliefs. Some people may choose “no religion” in response to a religious identity question on a survey because no other response option captures their identity. “Nones” may believe in deities, astrology or traditional religions – or they may believe in no supernatural beings whatsoever.
Together, these people represent 16% of the global population and make up the third-largest group. A majority of all religious “nones” live in Asia, with six-in-ten found in China alone. About 12% of the unaffiliated reside in Europe, and 6% are in North America. Fewer than 5% live in each of the remaining regions.
In terms of their share of regional populations, just over one-fifth of people in the Asia-Pacific region are religious “nones,” as are similar shares of Europeans and North Americans. About 8% of the total population in Latin America and the Caribbean, 3% of sub-Saharan Africans and less than 1% of all people in the Middle East-North Africa region have no religious affiliation.
Economic development and its influence on households is particularly relevant for the living arrangements of the religiously unaffiliated. Many “nones” live in richer countries with relatively high education levels and greater workforce participation, particularly among women. People in such countries typically have easy access to birth control, and, as they spend more years in school and working outside the home, they tend to have children later in life and therefore have less time for childbearing. They also have high life expectancies, which may increase their chances of living without young children in their care. Individuals, couples and small families can afford to live alone, rather than with other relatives.
Unaffiliated: Household size
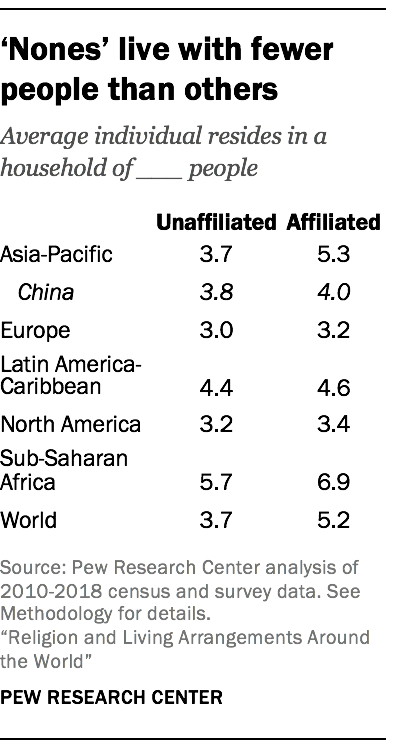
Since three-quarters of “nones” live in the Asia-Pacific region, norms in this region set the tone for this group worldwide, and China is particularly numerically influential. Indeed, relatively small households in China are one reason that religiously unaffiliated people globally live in substantially smaller households than affiliated people (3.7 vs. 5.2 people, on average). Similar gaps exist in the Asia-Pacific region and sub-Saharan Africa, but not in North America, Europe and the Latin America-Caribbean region; affiliated and unaffiliated people do not differ much in their household sizes in those regions.
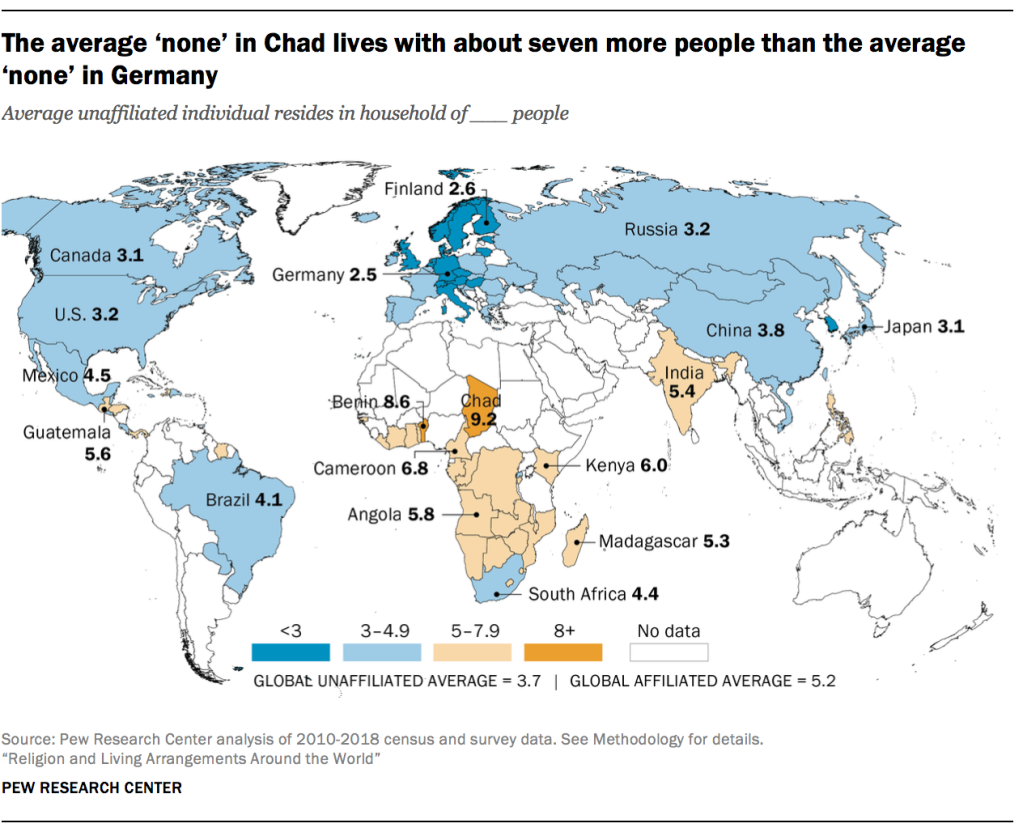
“Nones” follow typical regional patterns in relative household size, with the largest families in sub-Saharan Africa (5.7) and the smallest in Europe (3.0). At the country level, the unaffiliated have their smallest households in Germany (2.5 people, on average) and their biggest households in Chad (9.2).
Chad is one of only four countries in which the unaffiliated live in bigger households than their affiliated counterparts, and the gap is at least 0.5 people (Chadians with a religious affiliation live in households of 7.8 people, on average).40 In other countries, the unaffiliated live in households that are smaller than, or similar in size to, religiously affiliated households.
Differences in both household sizes and types are underpinned by the relatively high median age of the unaffiliated population (36 years, compared with 29 years for affiliated people) and their lower-than-average fertility rates. Globally, the average unaffiliated woman is expected to have about 1.6 children in her lifetime, compared with 2.5 for affiliated women.
Unaffiliated: Household types
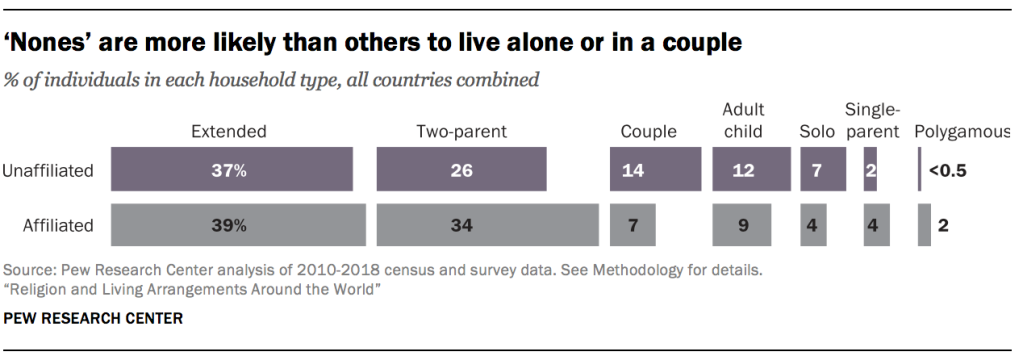
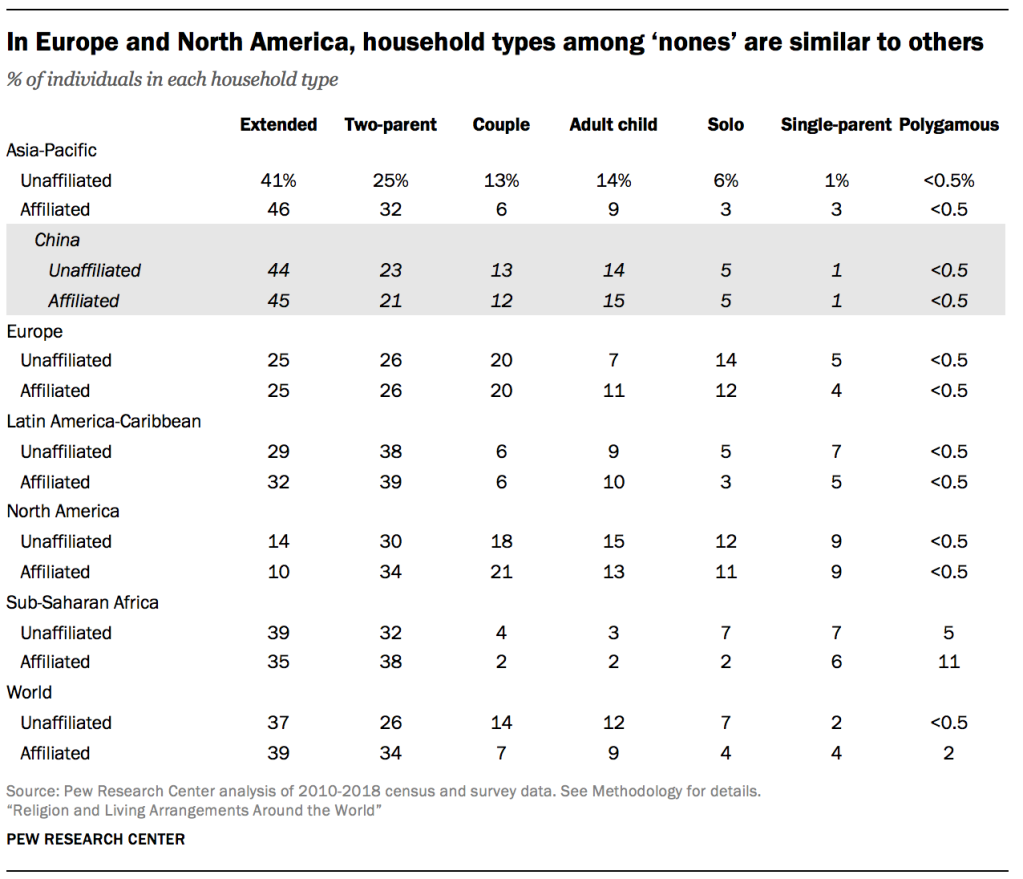
Living alone is more common among the religiously unaffiliated than among others (7% vs. 4%), as is living in a couple-only arrangement (14% vs. 7%) or in adult child households (12% vs. 9%). Conversely, fewer of the unaffiliated live in two-parent households with minor children (26% vs. 34%) or in single-parent homes (2% vs. 4%). Just over a third of “nones” live in extended-family homes, similar to the share of the affiliated who do so.
The small share of single-parent families among the unaffiliated worldwide is tied to the concentration of the unaffiliated in the Asia-Pacific region, where living in this type of household is uncommon across religious groups. This is especially true in China and South Korea, where many unaffiliated people live and single-parent families are particularly rare.
In sub-Saharan Africa, “nones” stand out for living alone at the highest rate of any group in the region (7%) – more than three times the share of affiliated people (2%). “Nones” in the Asia-Pacific region also are more likely than others to live alone (6% vs. 3%), as well as in a couple-only households (13% vs. 6%).
Differences between “nones” and others are not as pronounced in Latin America and the Caribbean, North America, and Europe.
Hindus
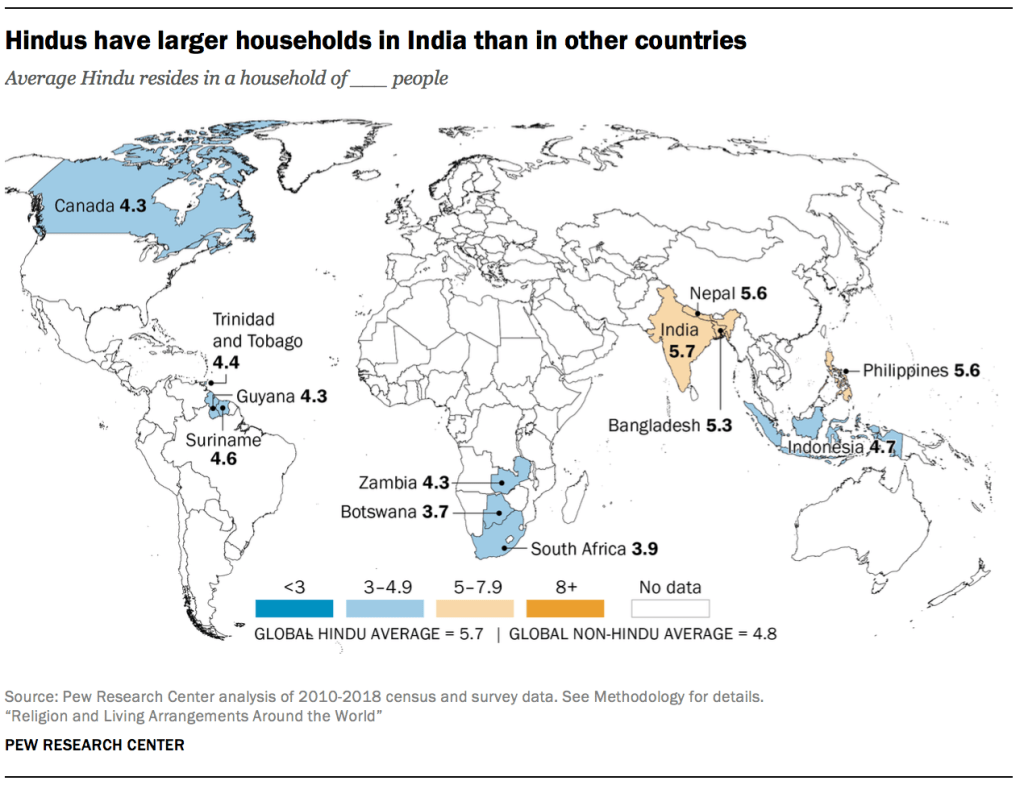
More than a billion people – almost one-sixth of the world’s population – are Hindu. Hindus are heavily concentrated in the Asia-Pacific region, and more than nine-in-ten of the world’s Hindus live in just one country: India. As a result, the global characteristics of Hindu households are heavily influenced by patterns in that country.
Even though most Hindus live in the Asia-Pacific region, they make up only about a quarter of all people in the world’s most populous region. Hindus represent less than 1% of the population in all other regions.41
Hindus: Household size
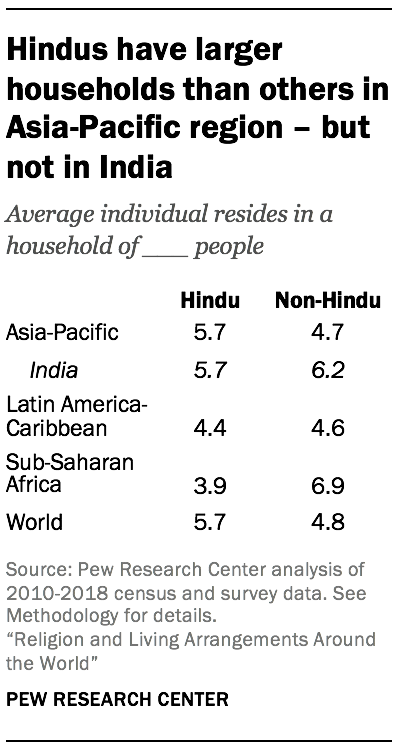
Globally, the average Hindu lives in a fairly large household (5.7 people), with nearly one person more than the average non-Hindu (4.8). In India, however, the reverse is true: Hindus live in slightly smaller households than non-Hindus (5.7 vs. 6.2) – even though Hindus’ biggest households are in India.
Hindus in the Latin America-Caribbean region – mostly found in Trinidad and Tobago, Guyana, and Suriname – live in slightly smaller households than other Latin Americans (4.4 vs. 4.6). Meanwhile, the small population of Hindus in sub-Saharan Africa – many of whom live in South Africa – have much smaller households than others in the region (3.9 vs. 6.9).
Hindus: Household types
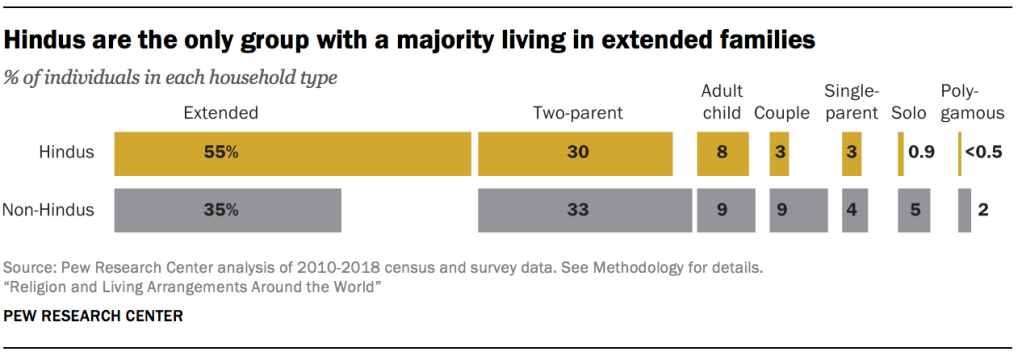
Globally, Hindus are the only religious group with a majority of people living in extended-family homes, with 55% residing in this type of arrangement. Relatedly, Hindus are less likely than non-Hindus to live in a couple-only arrangement (3% vs. 9%). Hindus, along with Muslims, have the smallest share of adherents who live alone (1% in each group).
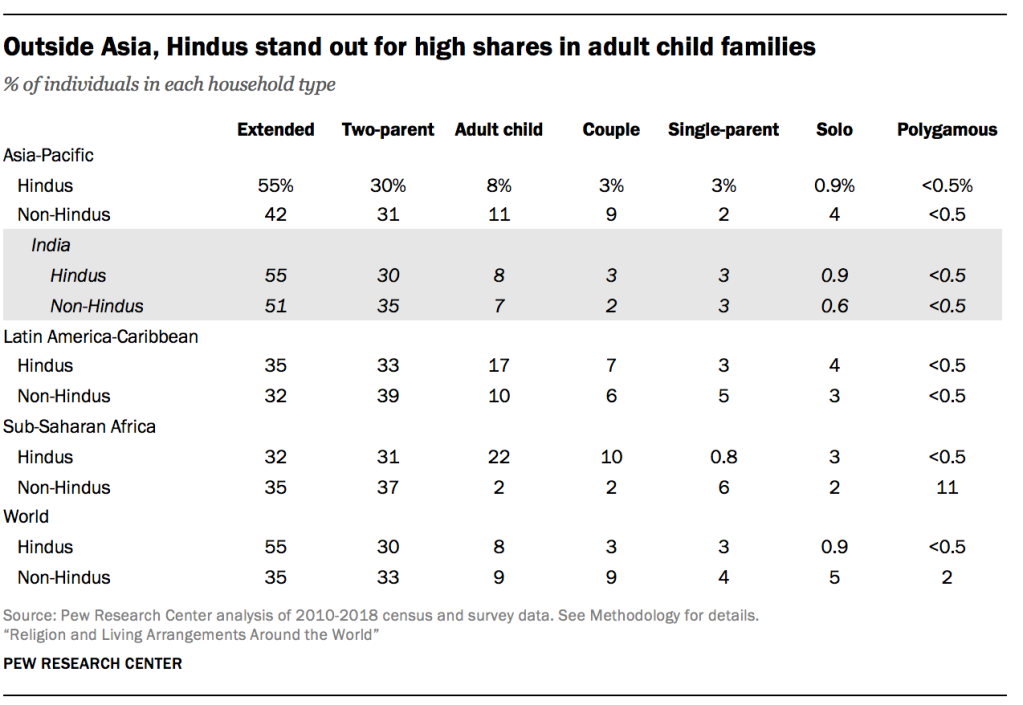
In the Asia-Pacific region, Hindus are far more likely than non-Hindus to live in extended families (55% vs. 42%). But this pattern is less pronounced in India, where religious minorities live in arrangements similar to Hindus. Indian Hindus are only a little more likely to live with extended family (55%, compared with 51% for non-Hindus).
Buddhists
With about 500 million adherents worldwide, Buddhists represent roughly 7% of the global population. Nearly 99% of Buddhists live in Asia and the Pacific. Buddhists make up just over 10% of all people in the Asia-Pacific region, 1% of North Americans and less than one-half of 1% of people in any other region.42
Buddhists: Household size
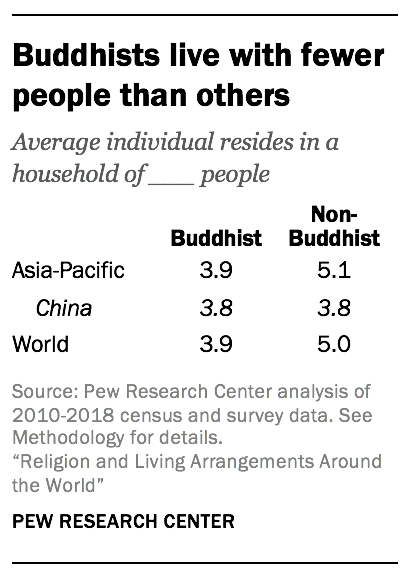
Around the world, Buddhists live with at least one fewer person, on average, than non-Buddhists do. This reflects the gap in Asia, where the average Buddhist lives in a household of 3.9 people, compared with 5.1 for non-Buddhists.
About half of the world’s Buddhists live in China, where they make up almost one-fifth of the population. In China, Buddhists live in households of 3.8 people, on average, as do non-Buddhists. The second-biggest population of Buddhists by country is in Thailand, where they make up over 90% of the population. In Thailand, Buddhists have an average household size of 4.1, whereas others live in larger households, with an average size of 4.7. (Most non-Buddhists in China are unaffiliated, while most non-Buddhists in Thailand are Muslim.)
Buddhists have their smallest families in Japan (3.0), where their average household sizes are about the same as those of non-Buddhists. In Canada, though, Buddhists live in bigger households than others (3.9 vs. 3.2), which is partly because Canadian Buddhists are more likely than other Canadians to live with extended family.

Buddhists: Household types
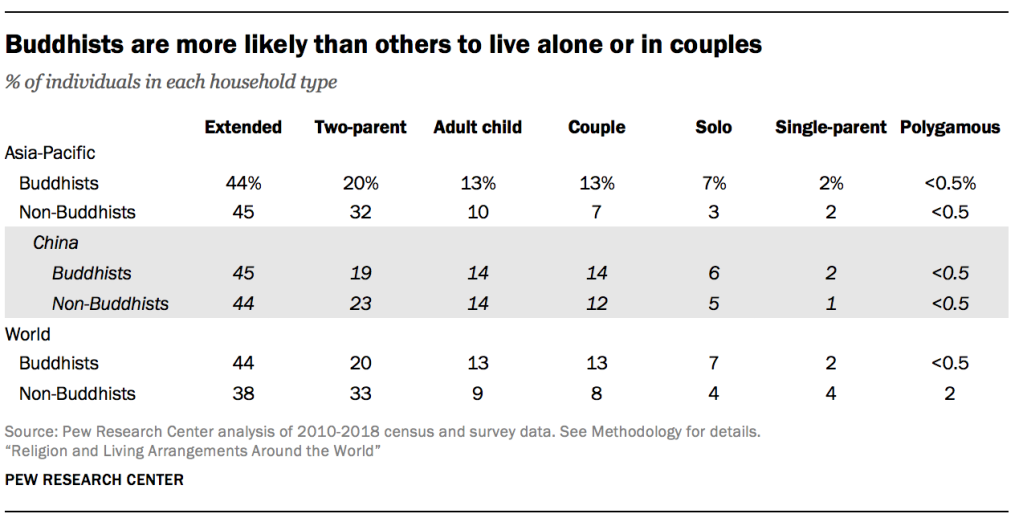
When it comes to household type, the biggest difference between Buddhists and non-Buddhists is in the relatively small percentage of Buddhists who live in two-parent households with minor children. One-fifth of Buddhists globally live in this arrangement, compared with one-third of non-Buddhists. In fact, of all major religious groups, Buddhists have the smallest share of adherents in this household type.
As a group, Buddhists are older than non-Buddhists, with a median age of 36, compared with 29 for non-Buddhists. And the average Buddhist woman is expected to have 1.6 children in her lifetime, well below the global figure for non-Buddhists (2.4). These demographic factors, which are themselves influenced by the legacy of the one-child policy in China, help to explain why Buddhists tend to have smaller households and are less likely to live in household types that by definition include minor children.
Buddhists also are unlikely to live in single-parent families (2%), which reflects the rarity of this type of household for all religious groups in the Asia-Pacific countries where most Buddhists are found, and the fact that there are relatively few Buddhists in countries or regions where single parenthood is common. At the country level, about the same share of Buddhists and non-Buddhists live in single-parent households in China, Thailand, Japan and Canada. Within the Asia-Pacific region, Nepal has the biggest share of Buddhists living in single-parent families (9%).
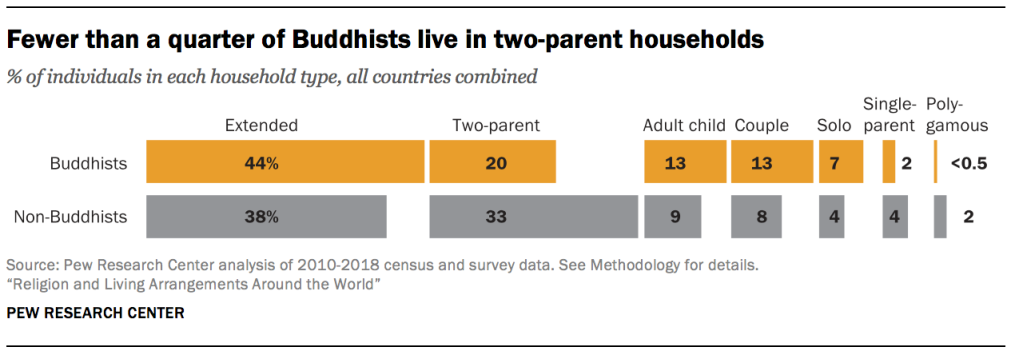
Globally, Buddhists are slightly more likely than others to live in extended-family households (44% vs. 38%), in couple-only households (13% vs. 8%), in adult child homes (13% vs. 9%) and alone (7% vs. 4%). Within the Asia-Pacific region, however, Buddhists and non-Buddhists live with extended family at about the same rate.
Jews
Globally and in every region, Jews are a minority religious group; they make up less than one-quarter of 1% of the global population. About 40% of Jews live in Israel, where they represent a large majority of the population, and a similar number live in the United States, where they form roughly 2% of the population.
Jews: Household size
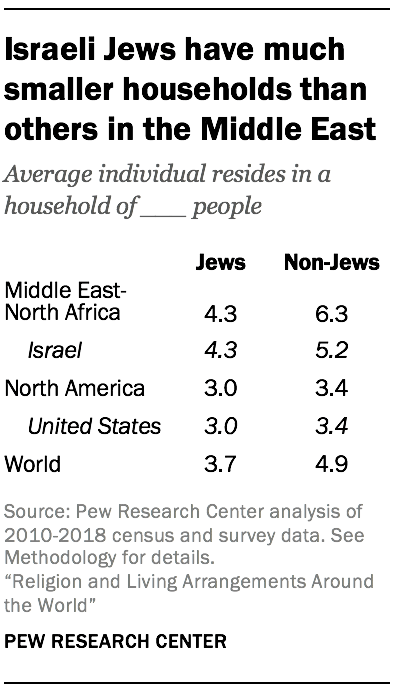
Jews in the Middle East-North Africa region live in bigger households than those in North America.43In Israel, Jews live in households of 4.3 people, on average (compared with 5.2 for non-Jewish Israelis); in the U.S., those figures are 3.0 and 3.4, respectively.44
Of all religious groups analyzed for this report, Jews are the oldest, with a median age of 37, compared with 30 among non-Jews. The comparatively high percentage of Jews who live alone or with only a spouse or partner can be partially attributed to their older age.
Jews: Household types
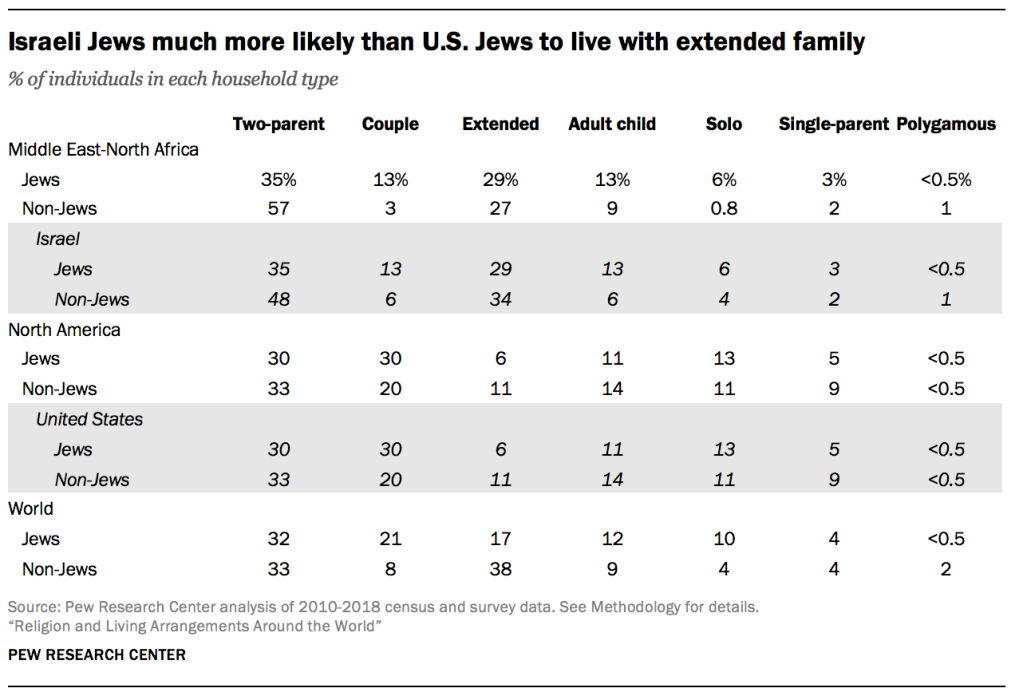
Globally, Jews have the biggest share of adherents in couple-only households and are more than twice as likely as non-Jews to live in this arrangement (21% vs. 8%). Jews are more likely to live as couples in the U.S. than in Israel (30% vs. 13%), and in both places, they are more likely than non-Jews to live with only a spouse or partner. Jews also are unique in that the couple-only household type is their second-most common (behind the two-parent family with minor children); in all other groups, two-parent and extended-family are the most common household types.
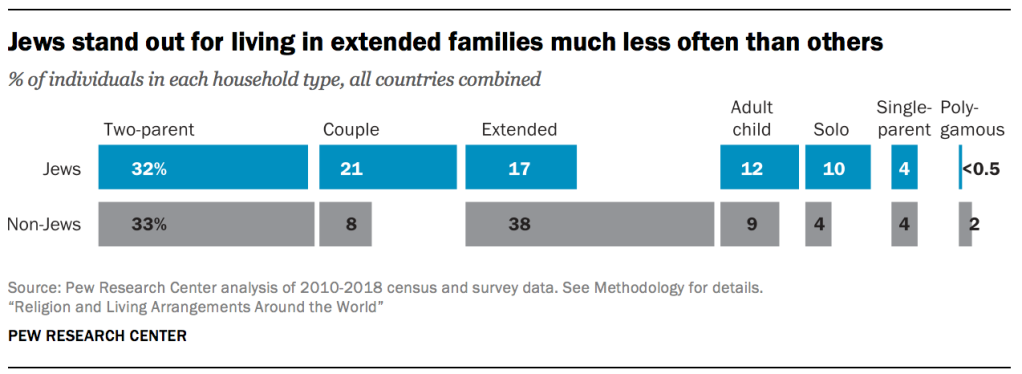
Jews have a much smaller share than others living in extended families (17% vs. 38%). Again, there are big differences in the experiences of U.S. Jews and Israeli Jews: While 29% of Israeli Jews live with extended family, only 6% of U.S. Jews do. Conversely, U.S. Jews live alone at about twice the rate of Israeli Jews (13% vs. 6%).
Studies often show links between religion and family life
Researchers who explore the connections between religion and household patterns often focus on major life events: marriage, divorce and childbearing. Their findings suggest that several measures of religion – a person’s affiliation, how important religion is to them and how often they participate in their congregation – have some influence on living arrangements. While many of the studies have been conducted in the U.S., using largely Christian samples, there is a growing body of research focused on other parts of the world.45 Some of these findings are presented here.
Marriage and divorce
Marriage, divorce and childbearing patterns are tied to religious identity and participation. In the U.S., evangelical Protestants are more likely than members of some other religious groups, including Catholics and mainline Protestants, to marry as young adults. Young evangelical Protestants also are less likely than others to live with a romantic partner outside of marriage.46 In the UK, the religiously affiliated, especially those who regularly attend religious services, also are less likely than “nones” to cohabit.47
Muslims are especially likely to marry: Studies have found that Muslims in many countries around the world are more likely than Christians to be married, and that in nations with larger shares of Muslims, women tie the knot at a younger age.48 Premarital sex is rarer among Muslims, and both Muslims and Buddhists are relatively unlikely to engage in extramarital sex. 49
The connection between divorce and religion also has interested researchers. Married “nones” are more likely than their religiously affiliated peers to go through a divorce at some point in their lives, according to a meta-analysis of 10 peer-reviewed research projects.50 Nevertheless, U.S. states with bigger shares of religious conservatives experience relatively high divorce rates, even though evangelical Protestants tend to emphasize the sanctity of marriage. This seeming contradiction may be explained by the tendency among conservative Protestants to marry at a younger age.51
Childbearing
In the baby boom years after World War II, U.S. Catholics tended to have more children than non-Catholics. But by 1979, Princeton demographers noted that this gap had nearly disappeared and declared “The end of Catholic fertility.”52
Around the globe, Muslims have higher fertility rates than Christians on average.53 Muslim women’s low educational attainment is a likely factor; demographers find that higher educational attainment among women is tied to lower fertility rates. 54 Even though fertility rates generally are declining in Muslim-majority nations, the above-average number of children born to Muslim women contributes to Muslims’ larger household sizes, as described elsewhere in this report. 55
Buddhism appears to have a unique association with procreation compared with the other major world religions: An analysis of fertility data in six Asian nations found that Buddhist affiliation was either unrelated to the number of children born or associated with having fewer children. This may be because Buddhism, unlike Abrahamic religions, does not have a specifically pro-natalist doctrine.56 (For more on religious teachings about family life, see this sidebar.)
In Western Europe, women who belong to religious groups and attend services more often tend to have more children.57