The American Trends Panel survey methodology
The American Trends Panel (ATP), created by Pew Research Center, is a nationally representative panel of randomly selected U.S. adults. Panelists participate via self-administered web surveys. Panelists who do not have internet access at home are provided with a tablet and wireless internet connection. The panel is being managed by Ipsos.
Data in this report are drawn from the panel wave conducted March 18 to April 1, 2019. A total of 6,364 panelists responded out of 8,396 who were sampled, for a response rate of 76%. This does not include five panelists who were removed from the data due to extremely high rates of refusal or straight-lining. The cumulative response rate accounting for nonresponse to the recruitment surveys and attrition is 5.3%. The break-off rate among panelists who logged onto the survey and completed at least one item is 1%. The margin of sampling error for the full sample of 6,364 respondents is plus or minus 1.7 percentage points.
The subsample from the ATP was selected by grouping panelists into four strata so demographic groups that are underrepresented in the panel had a higher probability of selection than overrepresented groups:
- Stratum A consists of panelists who identified as Mormon or as Jewish, or who are non-internet users or have a high school education or less. They were sampled at a rate of 100%.
- Stratum B consists of panelists that are Hispanic, unregistered to vote or non-volunteers. They were sampled at a rate of 77%.
- Stratum C consists of panelists that are black non-Hispanic or 18 to 34 years old. They were sampled at a rate of 28%.
- Stratum D consists of the remaining panelists. They were sampled at a rate of 23%.
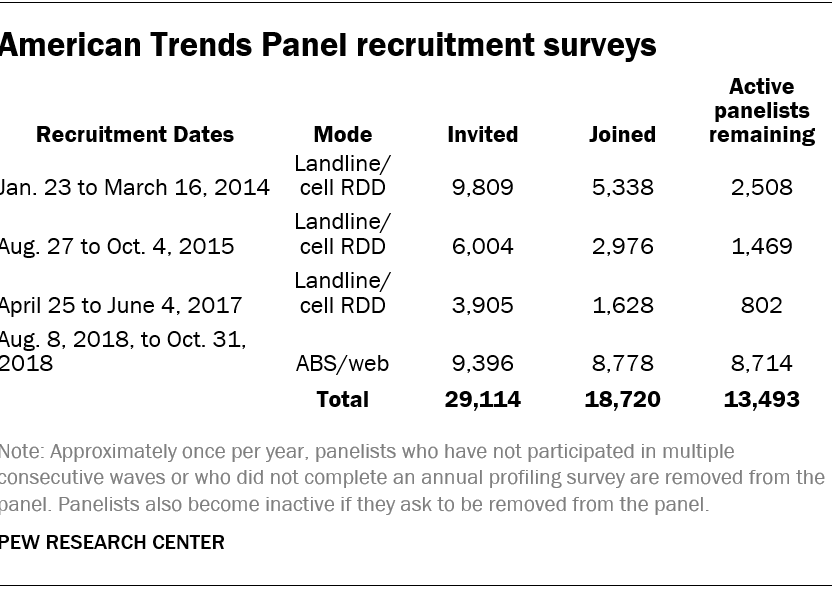
The ATP was created in 2014, with the first cohort of panelists invited to join the panel at the end of a large, national, landline and cellphone random-digit-dial survey that was conducted in both English and Spanish. Two additional recruitments were conducted using the same method in 2015 and 2017, respectively. Across these three surveys, a total of 19,718 adults were invited to join the ATP, of which 9,942 agreed to participate.
In August 2018, the ATP switched from telephone to address-based recruitment. Invitations were sent to a random, address-based sample (ABS) of households selected from the U.S. Postal Service’s Delivery Sequence File. In each household, the adult with the next birthday was asked to go online to complete a survey, at the end of which they were invited to join the panel. For a random half-sample of invitations, households without internet access were instructed to return a postcard. These households were contacted by telephone and sent a tablet if they agreed to participate. A total of 9,396 were invited to join the panel, and 8,778 agreed to join the panel and completed an initial profile survey. Of the 18,720 individuals who have ever joined the ATP, 13,493 remained active panelists and continued to receive survey invitations at the time this survey was conducted.
The U.S. Postal Service’s Delivery Sequence File has been estimated to cover as much as 98% of the population, although some studies suggest that the coverage could be in the low 90% range.7
Weighting
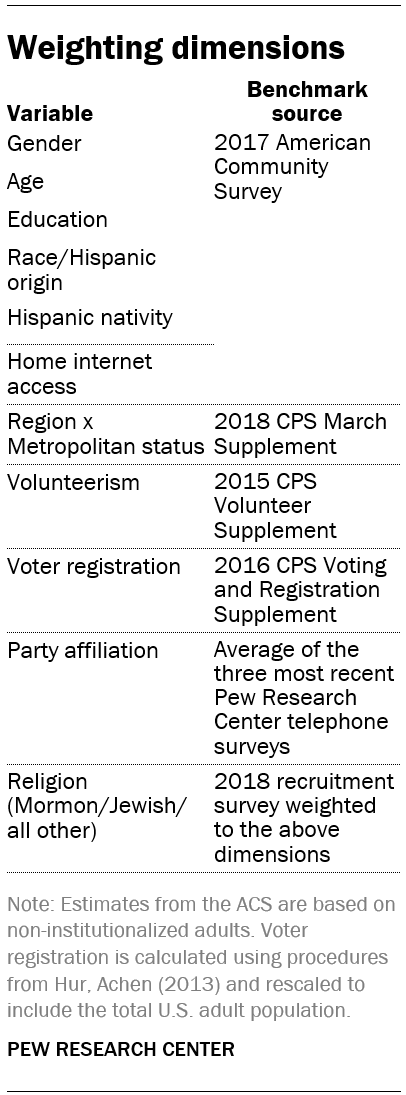
The ATP data were weighted in a multistep process that begins with a base weight incorporating the respondents’ original survey selection probability and the fact that in 2014 and 2017 some respondents were subsampled for invitation to the panel. The next step in the weighting uses an iterative technique that aligns the sample to population benchmarks on the dimensions listed in the accompanying table. For this wave, an additional weighting parameter was added to adjust for oversampling Mormon and Jewish respondents.
Sampling errors and tests of statistical significance take into account the effect of weighting. Interviews are conducted in both English and Spanish, but the American Trends Panel’s Hispanic sample is predominantly U.S. born and English speaking.
In addition to sampling error, one should bear in mind that question wording and practical difficulties in conducting surveys can introduce error or bias into the findings of opinion polls.
The following table shows the unweighted sample sizes and the error attributable to sampling that would be expected at the 95% level of confidence for different groups in the survey:
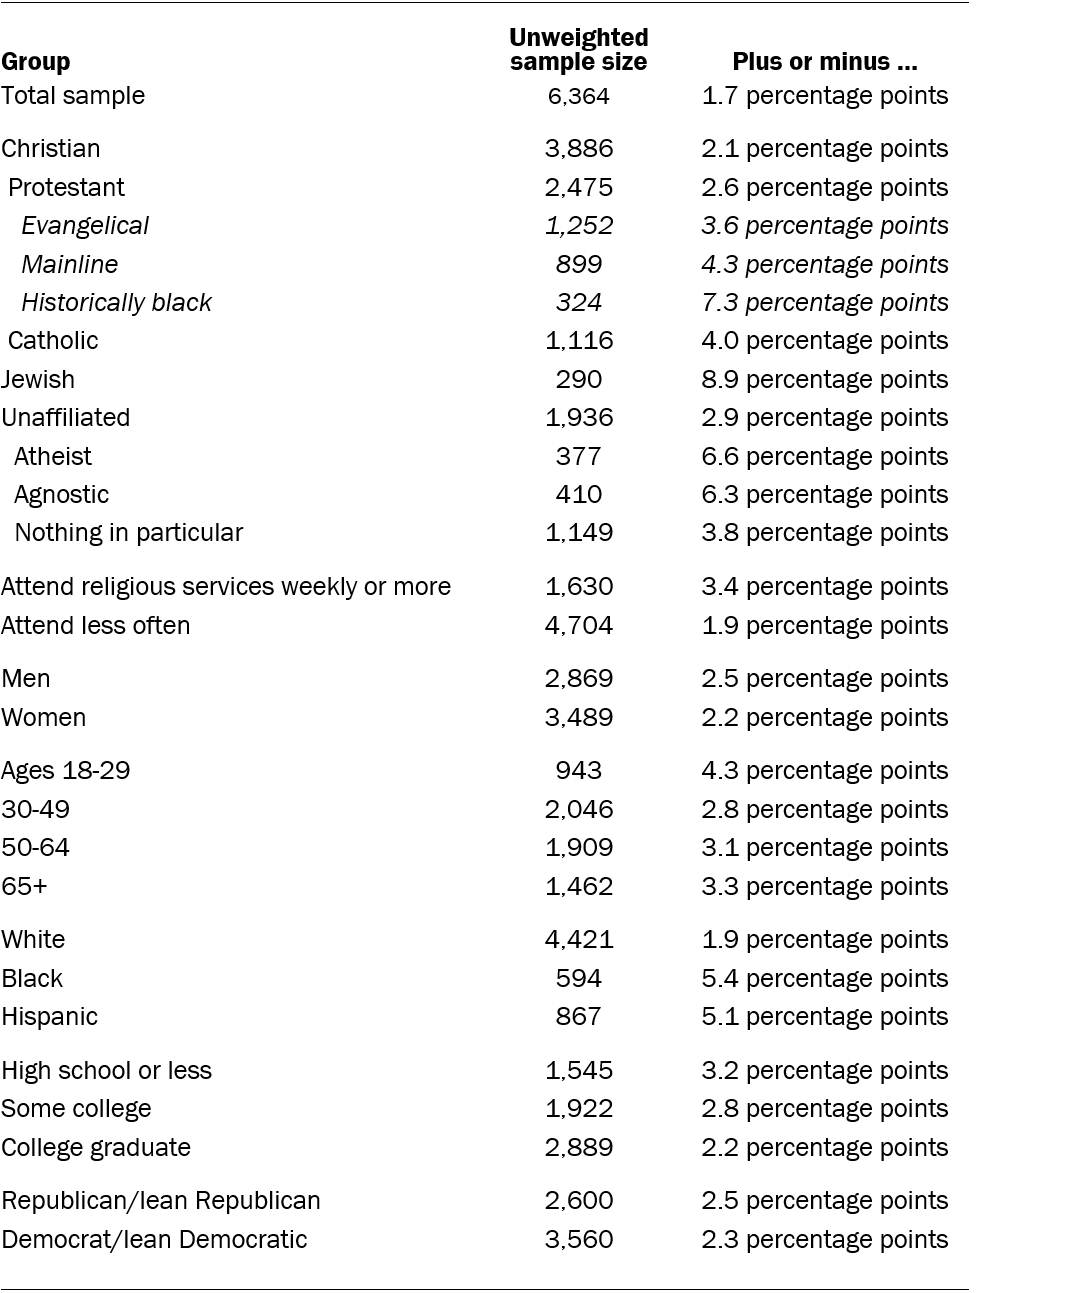
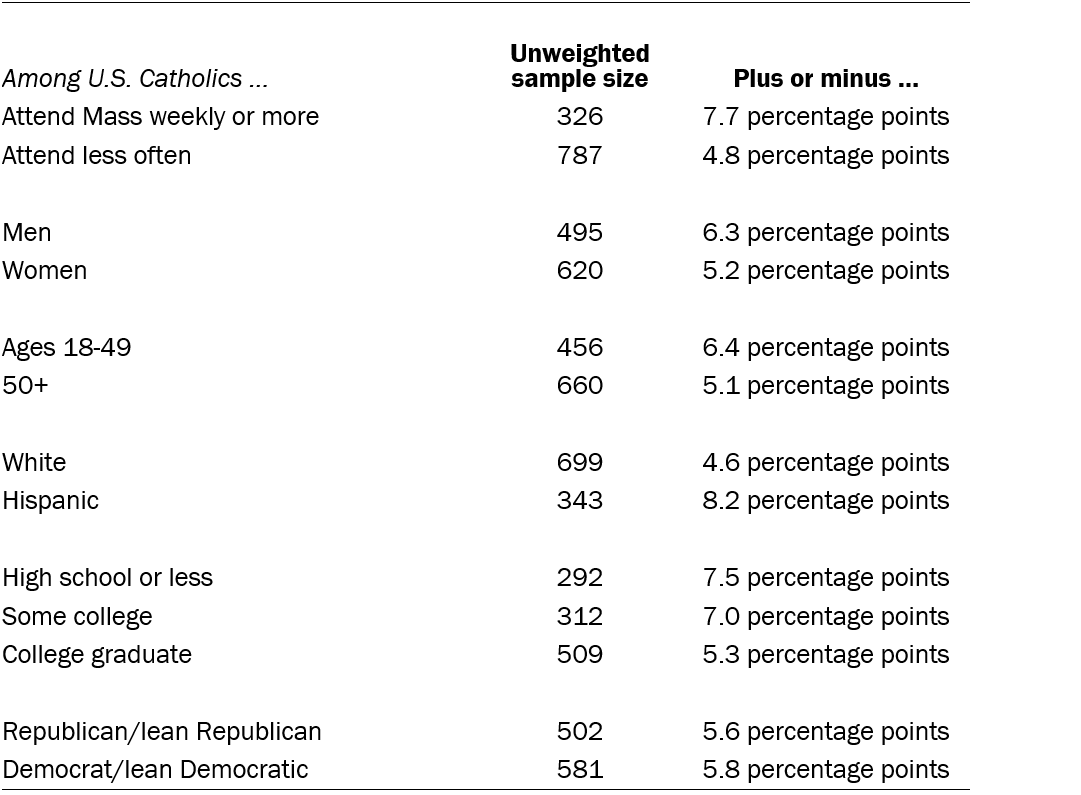
Sample sizes and sampling errors for other subgroups are available upon request.
© Pew Research Center, 2019