There were 24.8 million Asians in the United States in 2023, making up 7% of the total national population, according to estimates published by the U.S. Census Bureau. The Asian population has grown by 109% since 2000, when there were 11.9 million Asian people living in the U.S. Asians are the fastest-growing group among the country’s largest racial or ethnic groups, outpacing the growth rate of the Hispanic, Black and White populations during the same time period.1
The Asian American population is diverse. It consists of people with varied Asian origins, racial and ethnic identities, and immigrant experiences. The population includes people who self-identify as Asian alone or in combination with any other race or ethnicity.
This fact sheet is a profile of the geographic, social and demographic, and economic characteristics of the U.S. Asian population in 2023. It is based on Pew Research Center analysis of government data. (For more information, refer to the methodology.)
Two data sources provide population estimates for Asians in the U.S. for this analysis. The first is published U.S. Census Bureau tabulations of the 2023 American Community Survey (ACS). These tabulations use the full ACS dataset, so they are assumed to be the most accurate estimates for the U.S. Asian population and Asian origin group totals.
The second source is Pew Research Center tabulations of the 2021-23 ACS public-use files available through IPUMS, which we use to provide detailed demographic and other characteristics about the U.S. Asian population. In order to obtain larger sample sizes and report on more Asian origin groups, this analysis combines the 2021, 2022 and 2023 ACS and provides averaged estimates across the three years. These IPUMS public-use files are 1% samples of the U.S. population and are subsamples of the full ACS datasets used by the U.S. Census Bureau.
Because of these differences in how the data was compiled, population estimates may differ across the two sources. For more information and to compare these population estimates and their margins of error, refer to the methodology.
Note: In 2020, the U.S. Census Bureau revised the list of Asian origins to include Central Asians. This group made up about 2% of the Asian population overall in 2023. All figures are rounded according to rules shown in the methodology.
Source: 2000 decennial census and the 2010, 2019 and 2023 American Community Surveys (census tables).
PEW RESEARCH CENTER
Asian population by race, 2000-2023
U.S. Asian population
Note: In 2020, the U.S. Census Bureau revised the list of Asian origins to include Central Asians. This group made up about 2% of the Asian population overall in 2023. Racial groups are constructed regardless of Hispanic ethnicity. All figures are rounded according to rules shown in the methodology.
Source: 2000 decennial census and the 2010, 2019 and 2023 American Community Surveys (census tables).
PEW RESEARCH CENTER
Asian population by origin, 2023
% of Asians in the U.S. who are …
Note: All groups shown include those who identify with the given origin alone or in combination with any other race, ethnicity or Asian origin. “Chinese” does not include those who identify as Taiwanese alone. Figures do not add to 100% because individuals identifying with more than one Asian group are included in all groups. Only individual origin groups with a population size of 1 million or more in 2023 are shown. Refer to “Key facts about Asians in the U.S.” for a list of the 26 Asian origin groups individually identified by the U.S. Census Bureau in 2023.
Source: 2023 American Community Survey (census tables).
PEW RESEARCH CENTER
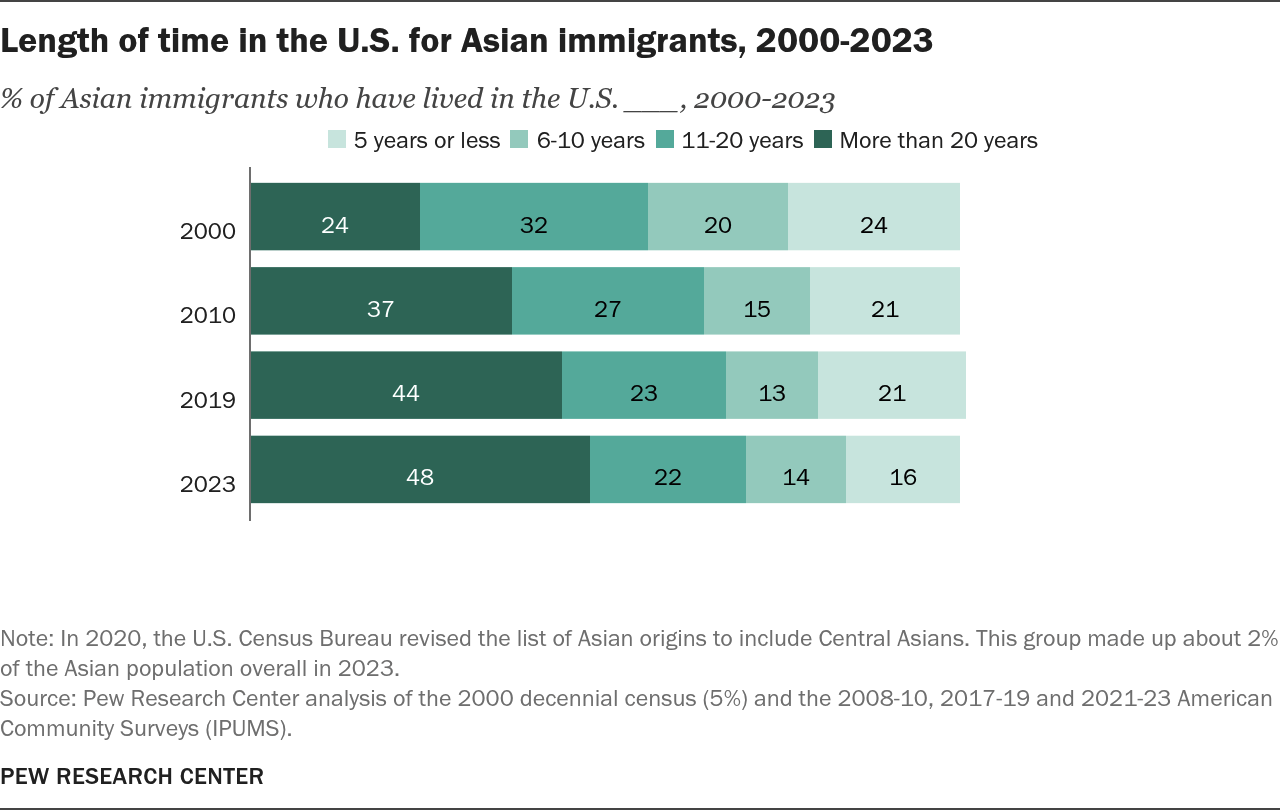
Length of time in the U.S.
Length of time in the U.S. for Asian immigrants, 2000-2023
% of Asian immigrants who have lived in the U.S. ___, 2000-2023
Note: In 2020, the U.S. Census Bureau revised the list of Asian origins to include Central Asians. This group made up about 2% of the Asian population overall in 2023.
Source: Pew Research Center analysis of the 2000 decennial census (5%) and the 2008-10, 2017-19 and 2021-23 American Community Surveys (IPUMS).
PEW RESEARCH CENTER
Share this chart
Length of time in the U.S. for Asian immigrants, 2000-2023
% of Asian immigrants who have lived in the U.S. ___, 2000-2023
Note: In 2020, the U.S. Census Bureau revised the list of Asian origins to include Central Asians. This group made up about 2% of the Asian population overall in 2023.
Source: Pew Research Center analysis of the 2000 decennial census (5%) and the 2008-10, 2017-19 and 2021-23 American Community Surveys (IPUMS).
PEW RESEARCH CENTER
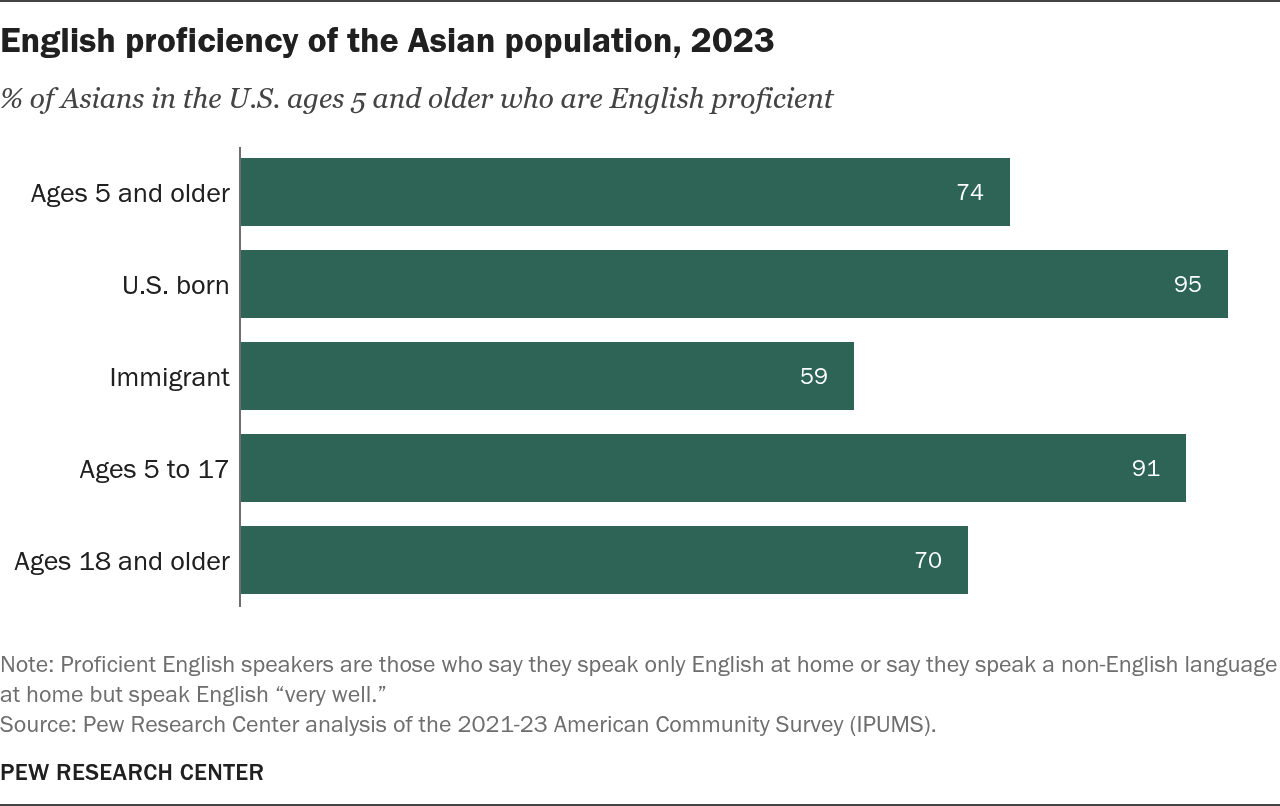
English proficiency
English proficiency of the Asian population, 2023
% of Asians in the U.S. ages 5 and older who are English proficient
Note: Proficient English speakers are those who say they speak only English at home or say they speak a non-English language at home but speak English “very well.”
Source: Pew Research Center analysis of the 2021-23 American Community Survey (IPUMS).
PEW RESEARCH CENTER
Share this chart
English proficiency of the Asian population, 2023
% of Asians in the U.S. ages 5 and older who are English proficient
Note: Proficient English speakers are those who say they speak only English at home or say they speak a non-English language at home but speak English “very well.”
Source: Pew Research Center analysis of the 2021-23 American Community Survey (IPUMS).
10 most spoken languages among the Asian population, 2023
% of Asians in the U.S. ages 5 and older who speak ___ at home*
* Identified languages spoken at home are based on self-reports. Names used are as reported by IPUMS and may not necessarily reflect recognized language names.
Source: Pew Research Center analysis of the 2021-23 American Community Survey (IPUMS).
PEW RESEARCH CENTER
Share this chart
10 most spoken languages among the Asian population, 2023
% of Asians in the U.S. ages 5 and older who speak ___ at home*
* Identified languages spoken at home are based on self-reports. Names used are as reported by IPUMS and may not necessarily reflect recognized language names.
Source: Pew Research Center analysis of the 2021-23 American Community Survey (IPUMS).
PEW RESEARCH CENTER
10 most spoken languages among Asian immigrants, 2023
% of Asian immigrants in the U.S. ages 5 and older who speak ___ at home*
* Identified languages spoken at home are based on self-reports. Names used are as reported by IPUMS and may not necessarily reflect recognized language names.
Source: Pew Research Center analysis of the 2021-23 American Community Survey (IPUMS).
PEW RESEARCH CENTER
Share this chart
10 most spoken languages among Asian immigrants, 2023
% of Asian immigrants in the U.S. ages 5 and older who speak ___ at home*
* Identified languages spoken at home are based on self-reports. Names used are as reported by IPUMS and may not necessarily reflect recognized language names.
Source: Pew Research Center analysis of the 2021-23 American Community Survey (IPUMS).
PEW RESEARCH CENTER
10 most spoken languages among U.S.-born Asians, 2023
% of U.S.-born Asians ages 5 and older who speak ___ at home*
* Identified languages spoken at home are based on self-reports. Names used are as reported by IPUMS and may not necessarily reflect recognized language names.
Source: Pew Research Center analysis of the 2021-23 American Community Survey (IPUMS).
PEW RESEARCH CENTER
Share this chart
10 most spoken languages among U.S.-born Asians, 2023
% of U.S.-born Asians ages 5 and older who speak ___ at home*
* Identified languages spoken at home are based on self-reports. Names used are as reported by IPUMS and may not necessarily reflect recognized language names.
Source: Pew Research Center analysis of the 2021-23 American Community Survey (IPUMS).
Top 10 metro areas of residence for the Asian population, 2023
U.S. Asian population living in each metropolitan area
Note: Metropolitan areas are based on the 2013 definitions from the U.S. Office of Management and Budget. All figures are rounded according to rules shown in the methodology.
Source: Pew Research Center analysis of the 2021-23 American Community Survey (IPUMS).
PEW RESEARCH CENTER
Share this chart
Top 10 metro areas of residence for the Asian population, 2023
U.S. Asian population living in each metropolitan area
Note: Metropolitan areas are based on the 2013 definitions from the U.S. Office of Management and Budget. All figures are rounded according to rules shown in the methodology.
Source: Pew Research Center analysis of the 2021-23 American Community Survey (IPUMS).
PEW RESEARCH CENTER
Top 10 metro areas of residence for Asian immigrants, 2023
Immigrant Asian population living in each metropolitan area
Note: Metropolitan areas are based on the 2013 definitions from the U.S. Office of Management and Budget. All figures are rounded according to rules shown in the methodology.
Source: Pew Research Center analysis of the 2021-23 American Community Survey (IPUMS).
PEW RESEARCH CENTER
Share this chart
Top 10 metro areas of residence for Asian immigrants, 2023
Immigrant Asian population living in each metropolitan area
Note: Metropolitan areas are based on the 2013 definitions from the U.S. Office of Management and Budget. All figures are rounded according to rules shown in the methodology.
Source: Pew Research Center analysis of the 2021-23 American Community Survey (IPUMS).
PEW RESEARCH CENTER
Top 10 metro areas of residence for the Asian population, 2023
U.S.-born Asian population living in each metropolitan area
Note: Metropolitan areas are based on the 2013 definitions from the U.S. Office of Management and Budget. All figures are rounded according to rules shown in the methodology.
Source: Pew Research Center analysis of the 2021-23 American Community Survey (IPUMS).
PEW RESEARCH CENTER
Share this chart
Top 10 metro areas of residence for the Asian population, 2023
U.S.-born Asian population living in each metropolitan area
Note: Metropolitan areas are based on the 2013 definitions from the U.S. Office of Management and Budget. All figures are rounded according to rules shown in the methodology.
Source: Pew Research Center analysis of the 2021-23 American Community Survey (IPUMS).
PEW RESEARCH CENTER
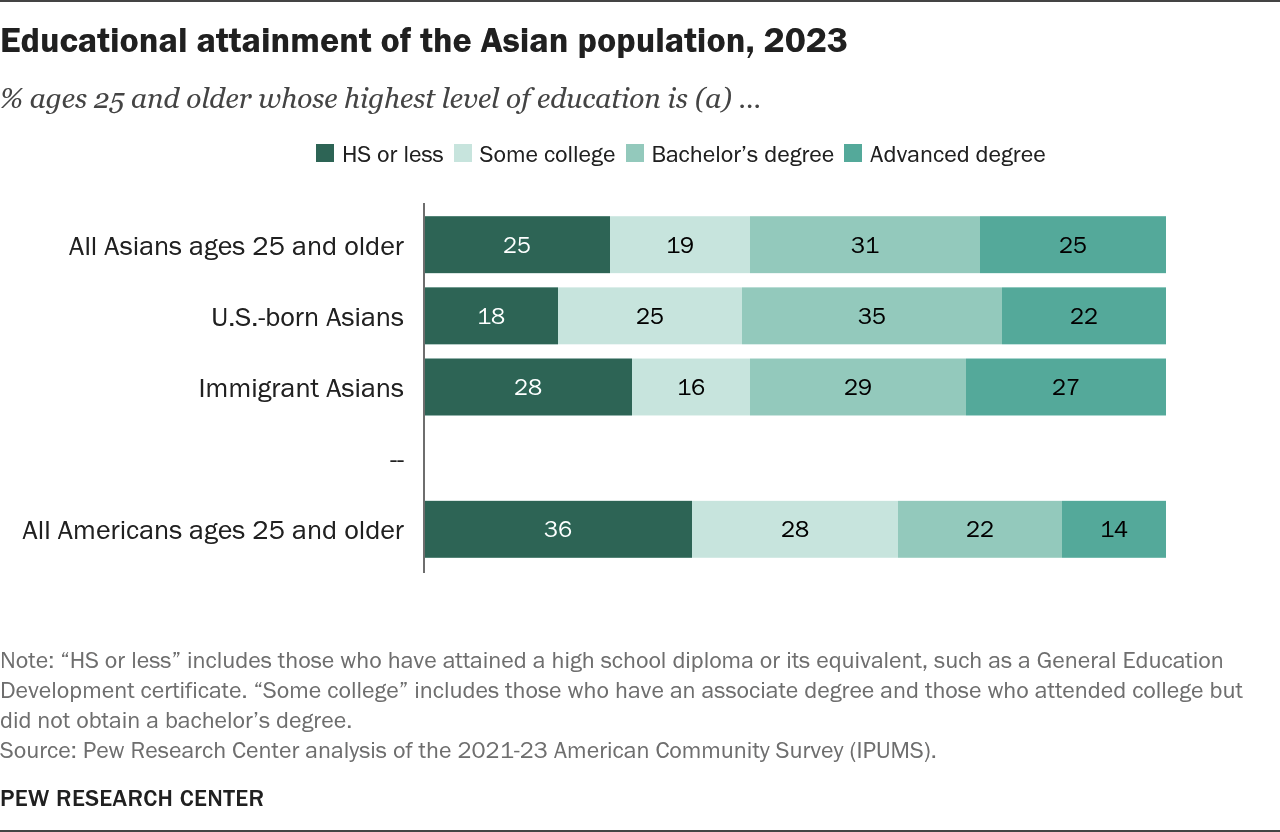
Educational attainment
Educational attainment of the Asian population, 2023
% ages 25 and older whose highest level of education is (a) …
Note: “HS or less” includes those who have attained a high school diploma or its equivalent, such as a General Education Development certificate. “Some college” includes those who have an associate degree and those who attended college but did not obtain a bachelor’s degree.
Source: Pew Research Center analysis of the 2021-23 American Community Survey (IPUMS).
PEW RESEARCH CENTER
Share this chart
Educational attainment of the Asian population, 2023
% ages 25 and older whose highest level of education is (a) …
Note: “HS or less” includes those who have attained a high school diploma or its equivalent, such as a General Education Development certificate. “Some college” includes those who have an associate degree and those who attended college but did not obtain a bachelor’s degree.
Source: Pew Research Center analysis of the 2021-23 American Community Survey (IPUMS).
PEW RESEARCH CENTER
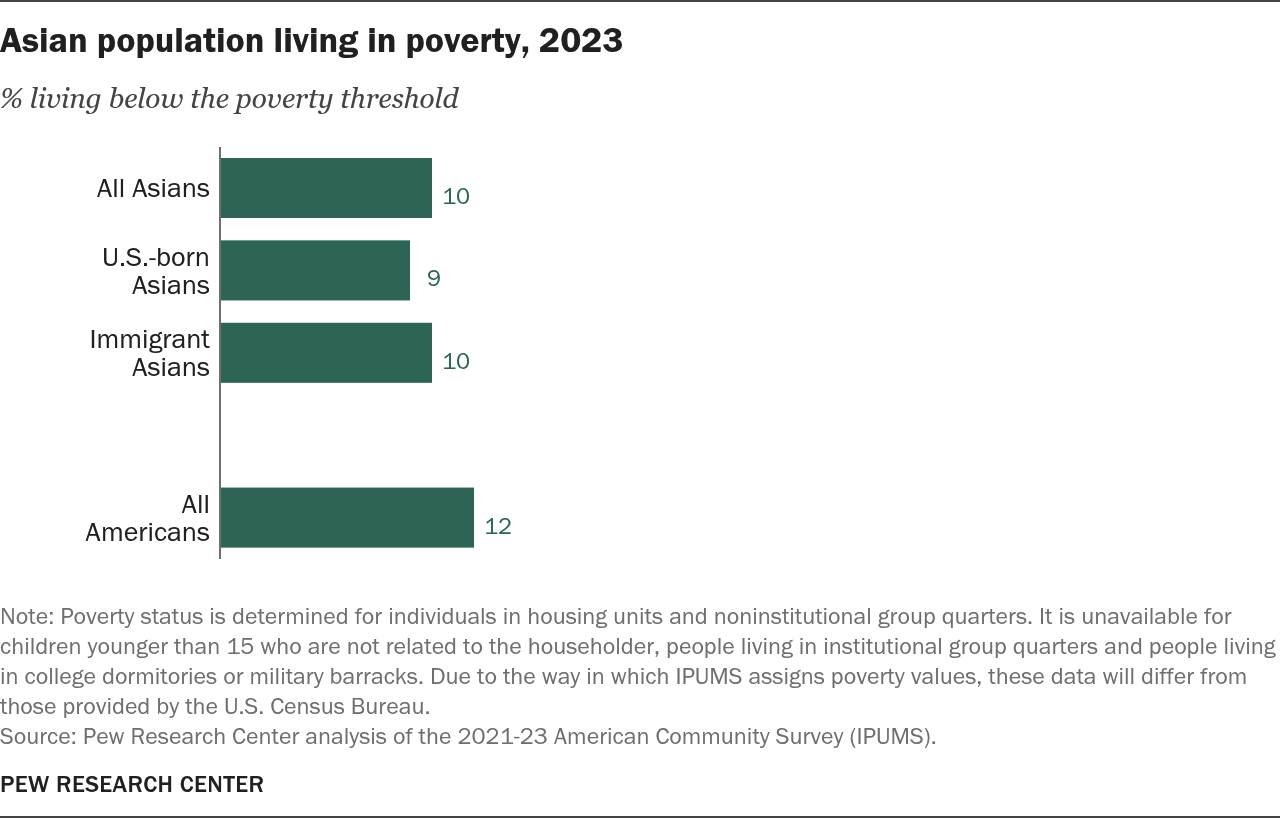
Poverty status
Asian population living in poverty, 2023
% living below the poverty threshold
Note: Poverty status is determined for individuals in housing units and noninstitutional group quarters. It is unavailable for children younger than 15 who are not related to the householder, people living in institutional group quarters and people living in college dormitories or military barracks. Due to the way in which IPUMS assigns poverty values, these data will differ from those provided by the U.S. Census Bureau.
Source: Pew Research Center analysis of the 2021-23 American Community Survey (IPUMS).
PEW RESEARCH CENTER
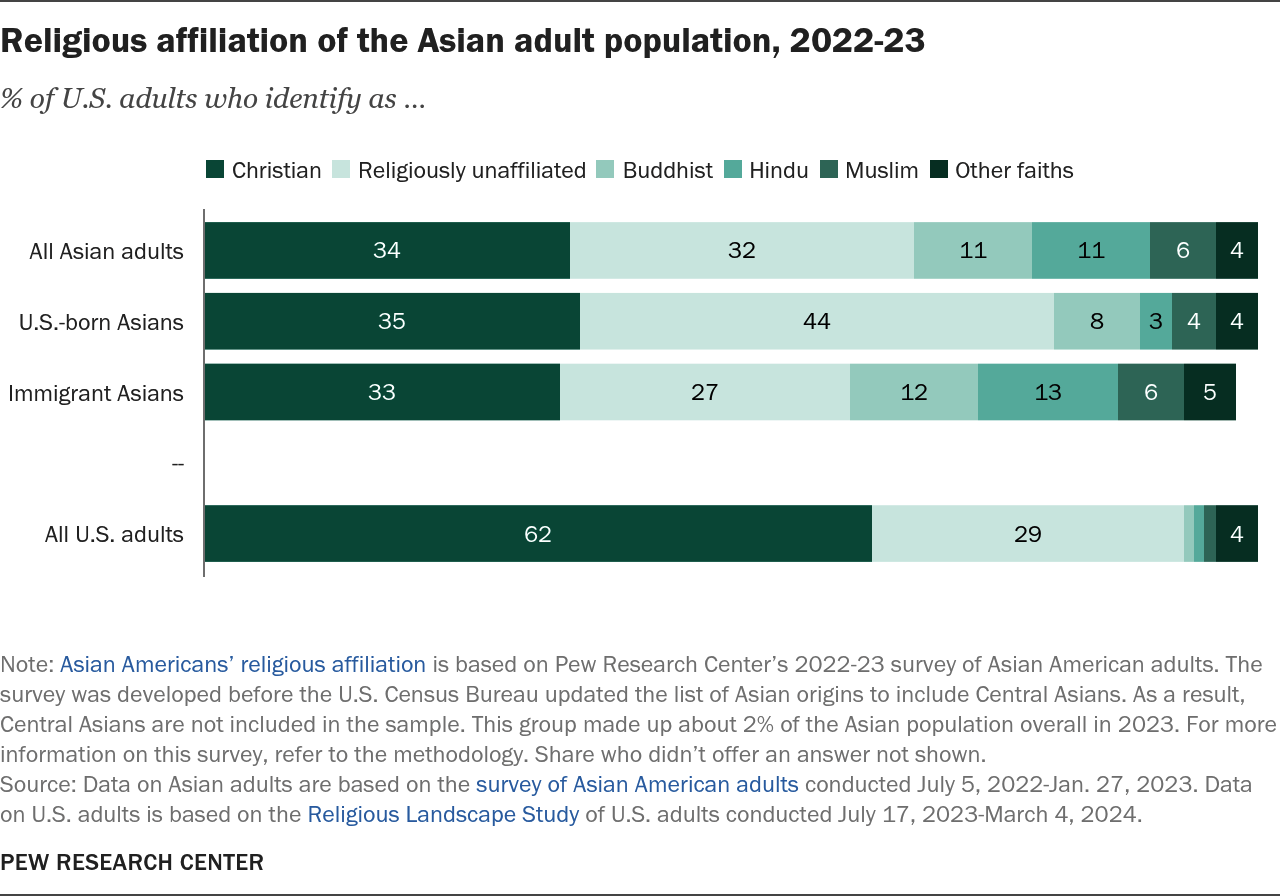
Religious affiliation
Religious affiliation of the Asian adult population, 2022-23
% of U.S. adults who identify as …
Note: Asian Americans’ religious affiliation is based on Pew Research Center’s 2022-23 survey of Asian American adults. The survey was developed before the U.S. Census Bureau updated the list of Asian origins to include Central Asians. As a result, Central Asians are not included in the sample. This group made up about 2% of the Asian population overall in 2023. For more information on this survey, refer to the methodology. Share who didn’t offer an answer not shown.
Source: Data on Asian adults are based on the survey of Asian American adults conducted July 5, 2022-Jan. 27, 2023. Data on U.S. adults is based on the Religious Landscape Study of U.S. adults conducted July 17, 2023-March 4, 2024.
PEW RESEARCH CENTER
Share this chart
Religious affiliation of the Asian adult population, 2022-23
Note: Asian Americans’ religious affiliation is based on Pew Research Center’s 2022-23 survey of Asian American adults. The survey was developed before the U.S. Census Bureau updated the list of Asian origins to include Central Asians. As a result, Central Asians are not included in the sample. This group made up about 2% of the Asian population overall in 2023. For more information on this survey, refer to the methodology. Share who didn’t offer an answer not shown.
Source: Data on Asian adults are based on the survey of Asian American adults conducted July 5, 2022-Jan. 27, 2023. Data on U.S. adults is based on the Religious Landscape Study of U.S. adults conducted July 17, 2023-March 4, 2024.
For detailed information on the data and analysis used for these fact sheets, read the methodology.
This fact sheet was written and compiled by Carolyne Im, research analyst.
The following individuals provided research and editorial guidance: Mark Hugo Lopez, director of race and ethnicity research; Jens Manuel Krogstad, senior writer and editor; Sahana Mukherjee, associate director of race and ethnicity research; Jeffrey S. Passel, senior demographer; Neil G. Ruiz, head of new research initiatives; and Ziyao Tian, research associate. Research Assistants Alexandra Cahn and Gracie Martinez and Research Associates Luis Noe-Bustamante, Khadijah Edwards and Tian provided research support.
This fact sheet was produced by Sara Atske, digital producer. It was copy edited by David Kent, senior copy editor. The communications and outreach strategy was led by Tanya Arditi, senior communications manager, with support from Talia Price, communications associate.
Between 2000 and 2023, the U.S. Asian population grew at the fastest rate (109%), compared with the Hispanic (85%), Black (33%) and White (12%) populations, based on Pew Research Center analysis of estimates published by the U.S. Census Bureau. However, the Hispanic population had the largest increase in population by number of people among these groups. Nearly 30 million more Hispanics were living in the U.S. in 2023 than 2000, compared with about 25 million more White Americans, 13 million more Asian Americans and 12 million more Black Americans. Hispanics are of any race. The Asian, Black and White populations include those who identify with the race alone or in combination with any other race or Hispanic ethnicity.↩