Pew Research Center’s fact sheets on Asians in the U.S. and the accompanying blog post examine the Asian population in the United States overall and by 22 origin groups – Bangladeshis, Bhutanese, Burmese, Cambodians, Chinese, Filipinos, Hmong, Indians, Indonesians, Japanese, Koreans, Laotians, Malaysians, Mien, Mongolians, Nepalese, Pakistanis, Sri Lankans, Taiwanese, Thai, Uzbeks and Vietnamese.
These fact sheets provide detailed geographic, social and demographic, and economic characteristics for Asians overall and for each Asian origin group. They are based on the most recent and historical data available from multiple sources, including the U.S. Census Bureau’s decennial census and American Community Survey and Pew Research Center’s 2022-23 survey of Asian American adults.
Detailed analysis is only included for groups with an unweighted sample size of 200 or more. Tests of statistical significance are based on the 95% confidence level. For IPUMS data, the 80 person-level replicate weights were used to generate standard errors.
All figures in these fact sheets are rounded. For population estimates, figures that are 250,000 or greater are rounded to the nearest 10,000; figures that are less than 250,000 and greater than or equal to 25,000 are rounded to the nearest 5,000; figures that are less than 25,000 and greater than or equal to 1,000 are rounded to the nearest 1,000; figures that are less than 1,000 are rounded to the nearest 100. Proportions are based on unrounded numbers. Figures may not sum to 100% or subtotals due to rounding. Additionally, ranked figures are based on the weighted estimates, and differences between rankings may not be statistically significant.
The term “immigrants,” when referring to government data, includes those who were not U.S. citizens at birth – in other words, those born outside the 50 U.S. states or the District of Columbia, Puerto Rico, or other U.S. territories to parents who were not U.S. citizens. When referring to survey respondents, this group only includes those born outside the 50 U.S. states or the District of Columbia, Puerto Rico or other U.S. territories.
Similarly, when referring to government data, the term “U.S. born” refers to people who are U.S. citizens at birth, including people born in the 50 U.S. states, the District of Columbia, Puerto Rico, or other U.S. territories, as well as those born elsewhere to at least one parent who is a U.S. citizen. When referring to survey respondents, this group only includes those born in the 50 U.S. states, the District of Columbia, Puerto Rico or other U.S. territories.
American Community Survey and decennial census
The American Community Survey (ACS) is the largest household survey in the United States, with a sample of more than 3 million addresses. It covers a wide range of topics on social, demographic and economic aspects of the American population. The ACS is designed to provide estimates of the size and characteristics of the resident population, which includes persons living in households and group quarters. For more about the ACS, including the sampling strategy and associated error, refer to the 2023 American Community Survey’s Accuracy of the Data document provided by the Census Bureau.
Data from IPUMS
The main source for this analysis is a three-year dataset constructed from the public-use files of the 2021, 2022 and 2023 ACS obtained through IPUMS from the University of Minnesota.
In order to obtain larger sample sizes and report on more Asian origin groups, this analysis combines the 2021-23 ACS from IPUMS and provides averaged estimates across the three years. These IPUMS public-use files are 1% samples of the U.S. population for each year.
Asians are identified as people who report their race to be Asian or any detailed Asian group, such as Hmong, Pakistani or Vietnamese. Self-identification as Asian may not necessarily match a respondent’s country of birth or their parents’ country of birth. Individuals who report Asian race may also report Hispanic origin as well as one or more non-Asian races, such as White or Black.
Population estimates are provided for all groups alone or in combination with other races, ethnicities or Asian origins, as available in the data. As a result, there is some overlap in the numbers for the individual Asian groups because people with origins in more than one Asian group are counted in each group to which they belong. For example, an individual identifying as “Chinese and Filipino” would be included in the totals for all Chinese and all Filipinos.
For Pew Research Center analysis of ACS data obtained through IPUMS, the alone or in combination populations are used for the seven origin groups for which it is available:
- Chinese
- Filipino
- Indian
- Japanese
- Korean
- Taiwanese
- Vietnamese
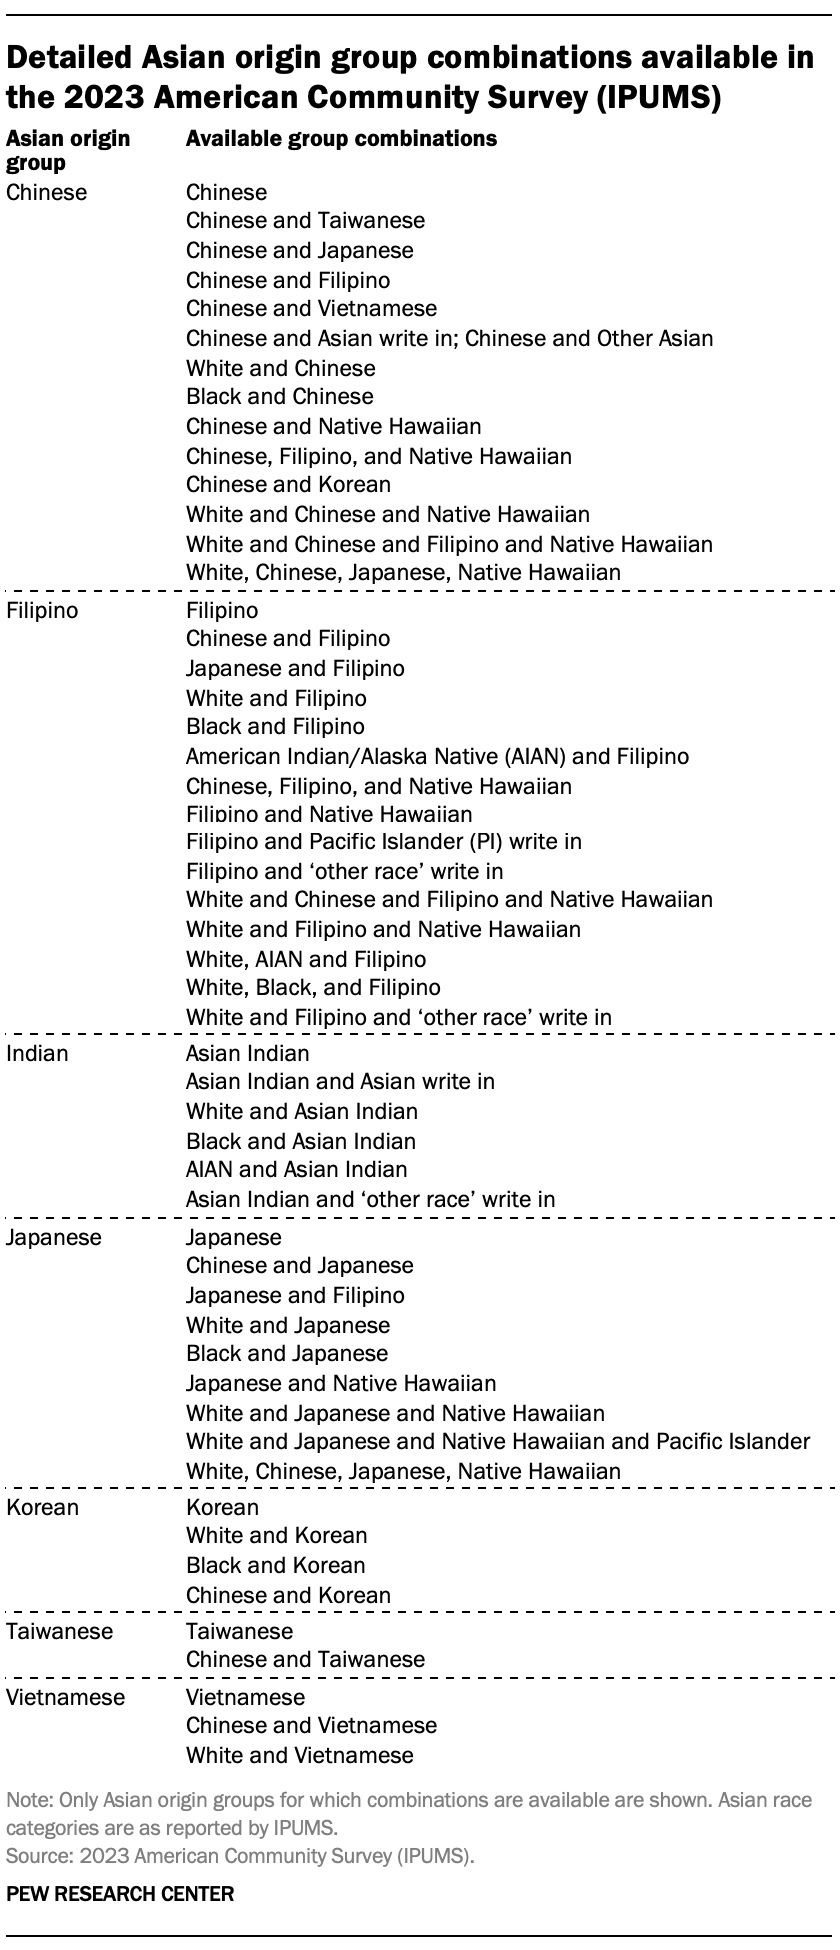
The people included in our various populations are limited by the groups reported and coded in the microdata by IPUMS and the U.S. Census Bureau. Not all individual groups, particularly the smaller groups, are coded when in combination with other groups. For example, there is no IPUMS code for “Chinese and Burmese.”
Additionally, when an individual reports multiple racial groups, IPUMS sometimes identifies the individual as Asian but does not identify their particular Asian origin. For example, IPUMS identifies the group “White and Black and American Indian/Alaska Native and Asian” but it does not have a distinct group for “White and Black and American Indian/Alaska Native and Japanese.” Because these groups do not identify a particular Asian origin, they are included in the estimates for Asians overall but cannot be coded into any detailed Asian origin group in this analysis.
The table below lists all of the Asian origin in combination groups available in the 2023 ACS. Refer to the IPUMS codebook for the detailed race variable for more information and for in combination group available for previous years.
Analysis of the remaining 17 individual Asian origin groups identified in the IPUMS ACS data is limited to the origin group alone populations:
- Bangladeshi
- Bhutanese
- Burmese
- Cambodian
- Hmong
- Indonesian
- Kazakh
- Laotian
- Malaysian
- Mien
- Mongolian
- Nepalese
- Pakistani
- Sikh
- Sri Lankan
- Thai
- Uzbek
The 2023 ACS is the first public dataset to identify Kazakh, Mien, Sikh and Uzbek as separate Asian groups. The sample sizes for Kazakh and Sikh do not meet our criteria for reporting details on them separately, but Mien and Uzbek do. Accordingly, we provide profiles on these latter two groups based only on the 2023 data.
To provide trends to previous years, this analysis additionally uses a three-year dataset constructed from the IPUMS public-use files of the 2017-19 ACS. It also uses the 2008-10 ACS and the 2000 decennial census (5% sample) available on IPUMS.
Data from U.S. Census Bureau tables
Due to the limitations in the IPUMS data discussed above, this analysis uses additional data published by the U.S. Census Bureau to provide single-year population estimates for 2023 and previous years. It uses the following tables:
2023 ACS:
- Overall Asian population: Table S0201
- Detailed Asian origin group alone or in combination populations: Table B02018
- Detailed Asian origin group alone populations: Table B02015
2019 ACS:
- Overall Asian population: Table S0201
- Detailed Asian origin group alone or in combination populations: Table B02018
- Detailed Asian origin group alone populations: Table B02015
2010 ACS:
- Overall Asian population, detailed Asian origin group alone or in combination and detailed Asian origin group alone populations: Table S0201
2000 decennial census:
- Overall Asian population, detailed Asian origin group alone or in combination and detailed Asian origin group alone populations: Table DP2 Summary File 4
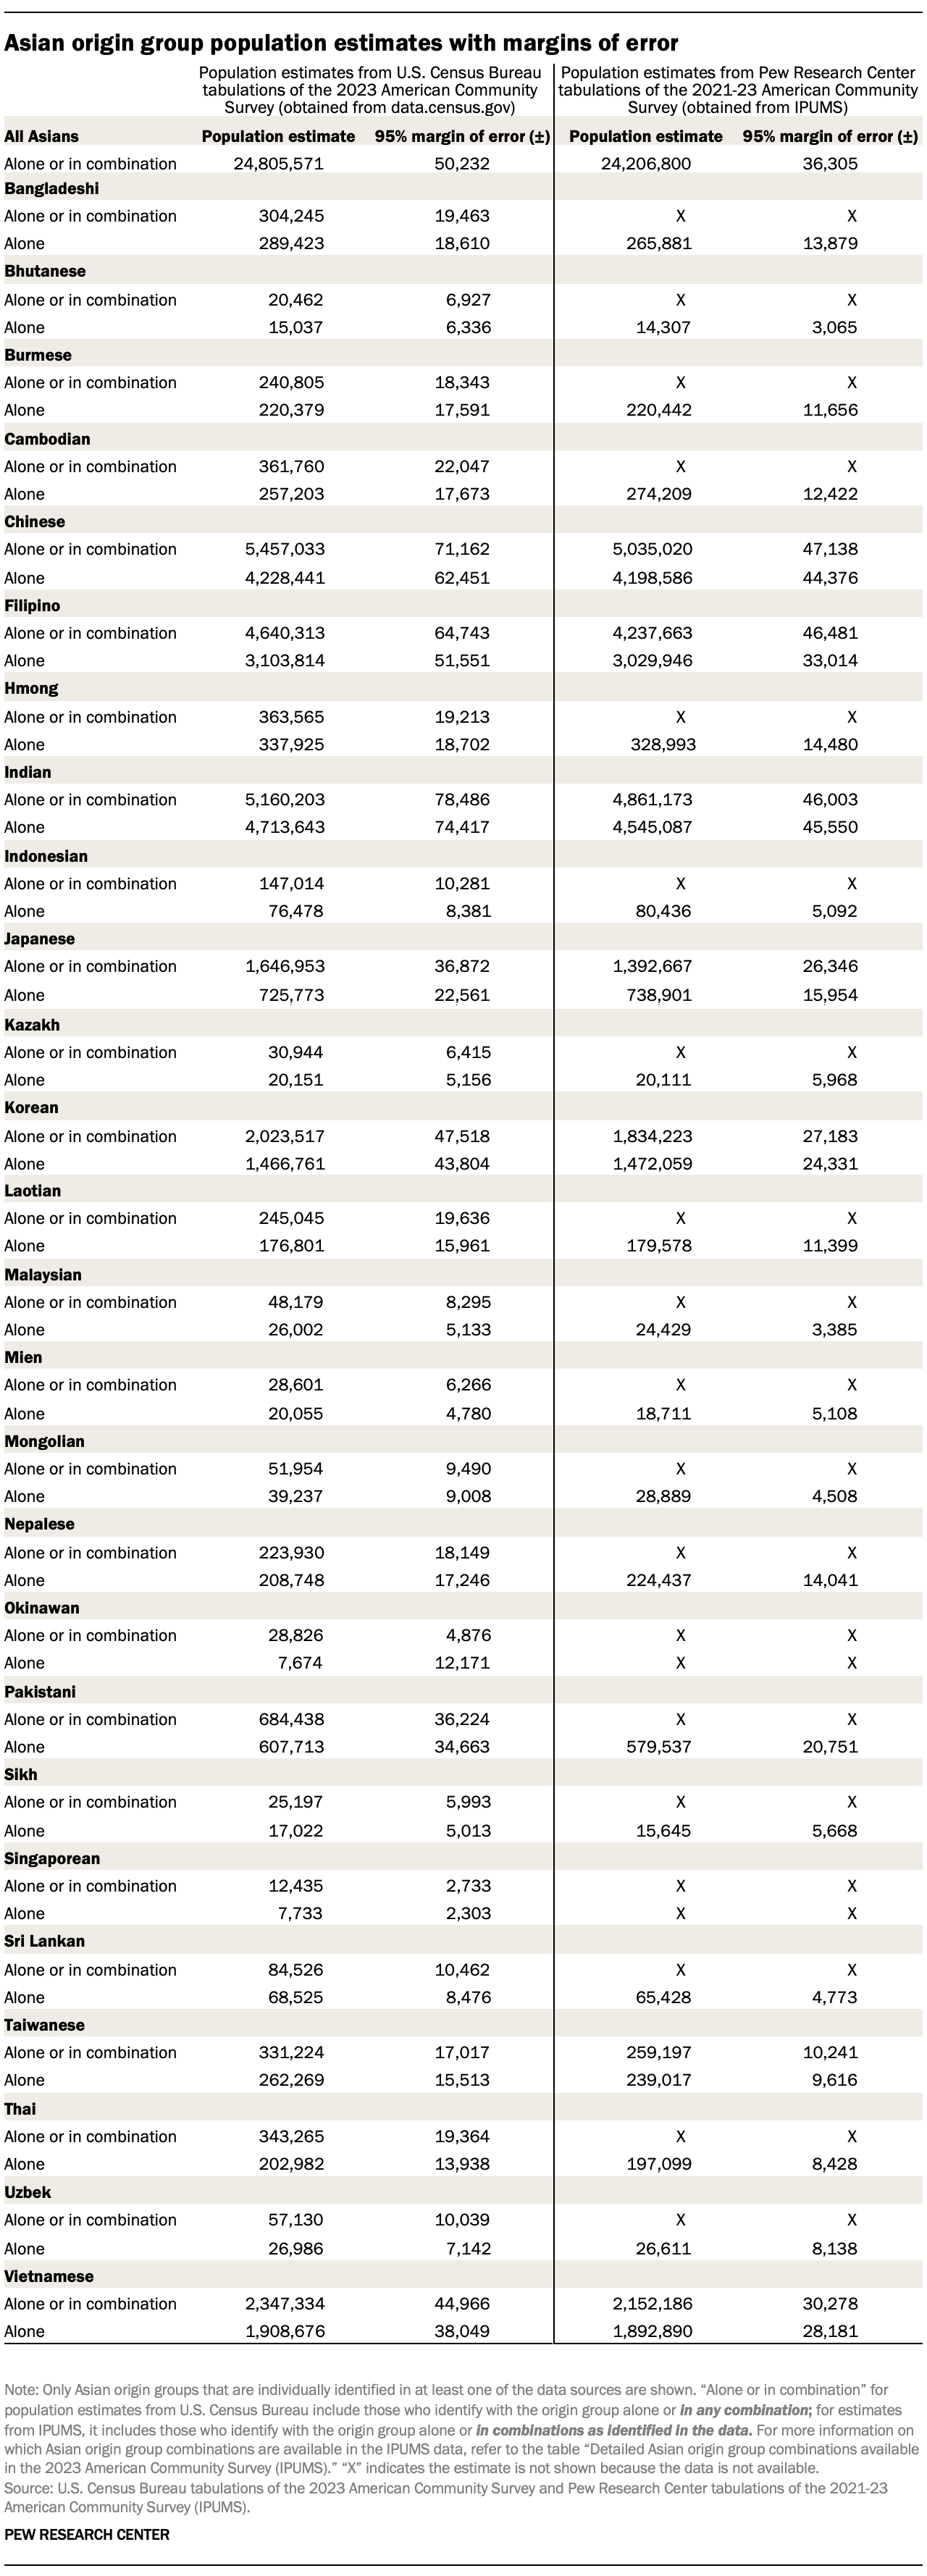
Population estimates from the two data sources
The figures derived from the IPUMS data do not precisely match published Census Bureau estimates. A number of reasons contribute to the discrepancies, including that the IPUMS data is a subsample of the full ACS sample; we are using a constructed three-year dataset that provides averaged estimates; and the IPUMS data do not include all alone or in combination groups.
Meanwhile, the tabulations published by the Census Bureau are based on the full ACS sample and use all details supplied by respondents. As such, the bureau can report on groups not identified in the public-use microdata (e.g., Okinawan, Singaporean), can provide all reported combinations and can provide counts of some of the smaller origin group alone or in combination populations.
The table below compares the population estimates and their margins of error based on the two data sources:
Pew Research Center’s 2022-23 survey of Asian Americans
The religious affiliation of Asian American adults included in these fact sheets is based on Pew Research Center’s 2022-23 survey of Asian Americans, a nationally representative survey of 7,006 Asian adults. The survey was fielded July 5, 2022, through Jan. 27, 2023, and was offered in six languages: Chinese (Simplified and Traditional), English, Hindi, Korean, Tagalog and Vietnamese. This survey does not include Central Asians, groups that account for 2% of the U.S. Asian population in 2023.
For more details, refer to the Asian American survey methodology and acknowledgments.
Pew Research Center’s 2023-24 Religious Landscape Study
The religious affiliation of U.S. adults included in these fact sheets is based on Pew Research Center’s Religious Landscape study, a nationally representative survey of 36,908 U.S. adults. The survey was fielded July 17, 2023, through March 4, 2024, and was offered in English and Spanish.
For more details, refer to the Religious Landscape Study methodology and acknowledgments.


