White students’ growing exposure to minority students and minority students’ declining exposure to white students both largely stem from the same well-known shifts in ethnic and racial composition that have occurred throughout the U.S. population in general. These shifts have been even more acute in the public schools. Though white enrollment has remained flat at 28 million students, the total number of students educated in public schools has increased from 43 million in 1993-94 to 48 million in 2005-06. The reason is that the number of minority students (especially Hispanics) has increased significantly. In effect, there are more minority students per white student, increasing white exposure to minority students. However, the flip side of this equation is that there are fewer white students per minority student, decreasing minority students’ exposure to white students (see also Logan, 2004).
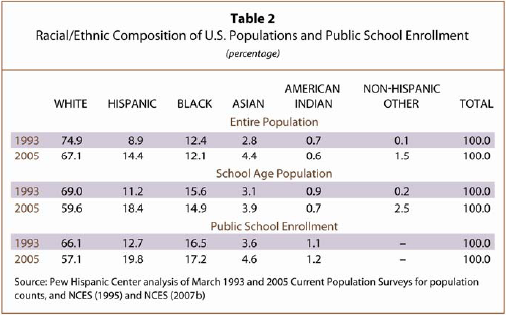
Whites have constituted a declining share of the total U.S. population in the period under study, but this change has occurred to an even greater degree in the public school population. In 2005, about two-thirds of the entire U.S. population identified themselves as white, a decline from three-quarters in 1993 (Table 2).3 The shift has been greater among children. The white share of school-age children declined from 69% in 1993 to 59.6% in 2005. And among students in public schools, the white share of enrollment declined from 66.1% in 1993-94 to 57.1% in 2005-06.
Modestly declining white public school enrollment has been more than offset by very large increases in Hispanic enrollment. The Hispanic slice of the public school population has increased more than 55%. Latinos in 2005-06 accounted for 19.8% of all public school students, up from 12.7% in 1993-94. During this same period, the black share of public school enrollment rose slightly — to 17.2%, from 16.5%.
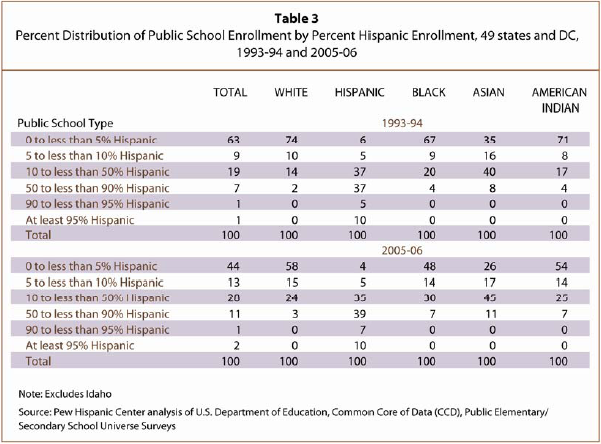
Reflecting the boom in Hispanic enrollment in public schools since 1993-94, all major racial and ethnic groups have become more exposed to Hispanic students. Public schools with less than 5% Hispanic enrollment educated 74% of white students and 67% of black students in 1993-94 (Table 3). By 2005-06, these schools educated just 58% of white students and 48% of black students. Asian students have also become less likely to be educated in a public school with less than 5% Hispanic enrollment (35% versus 26%).


