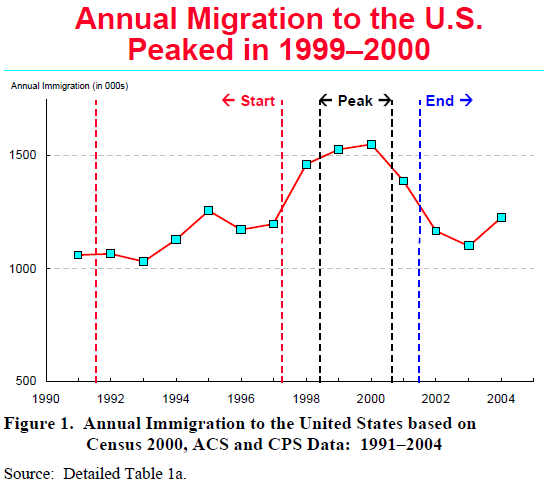
At the start of the 1990s, immigration flows had reached historically high levels of more than a million people a year. (See Detailed Table 4 and Figures 8–9.) In the early and middle parts of the 1990s, the annual numbers held relatively steady at around 1.1 million people a year. Depending on the measure used, the flows started increasing between 1995 and 1997 towards about 1.2 million per year (Detailed Table 2a).
By 1999, immigration levels had increased substantially to the point where the average inflow during the peak period of immigration—a period encompassing 1999–2000 in most estimates and extending a year in either direction in some—reached at least 1.5 million per year. Again, this figure is “an average of averages” that may actually understate the inflows of immigrants, since about 1.8 million arrived in 1999 according to data from Census 2000 (Detailed Table 2a). The average annual level of immigration during this peak period is about 400,000 greater than during the mid-1990s, or about one third higher (Detailed Table 1a).

After 2001, the annual inflow of immigrants slowed a bit and decreased to a level of 1.1 million to 1.2 million per year. Thus, average annual immigration declined by about 300,000 to 400,000 per year or at least 20% below the peak. With the decrease, immigration appears to have returned to roughly the levels of the mid-1990s. However, some data from the most recent March CPS and the American Community Survey (ACS) give contradictory pictures of current flows; some measures suggest continued lower levels of inflows, but others point to very recent (i.e., late 2004 and 2005) increases in migration from Mexico and Latin America. According to these measures, migration flows could again be approaching 1.3 million a year and moving upward.
All the measures and data sources, however, are consistent in telling the same basic story: Migration flows gradually increased in the mid-1990s, grew very rapidly at the end of the decade, peaked for two or three years and then fell off after 2002, returning to roughly the same levels as before the run-up. (See “Measurement Methods” and Figure 10.)


