
The American Trends Panel survey methodology
The American Trends Panel (ATP), created by Pew Research Center, is a nationally representative panel of randomly selected U.S. adults. Panelists participate via self-administered web surveys. Panelists who do not have internet access at home are provided with a tablet and wireless internet connection. Interviews are conducted in both English and Spanish. The panel is being managed by Ipsos.
Data in the first part of this report is drawn from the panel wave conducted Aug. 31 to Sept. 7, 2020. A total of 9,220 panelists responded out of 9,810 who were sampled, for a response rate of 94%. This does not include two panelists who were removed from the data due to extremely high rates of refusal or straightlining. The cumulative response rate accounting for nonresponse to the recruitment surveys and attrition is 5%. The break-off rate among panelists who logged on to the survey and completed at least one item is 1%. The margin of sampling error for the full sample of 9,220 respondents is plus or minus 1.7 percentage points.
The subsample from the ATP consisted of 9,810 ATP members that responded to the Wave 57 survey, the annual profile survey and were still active. Panelists who had not yet completed the annual profile survey were ineligible.
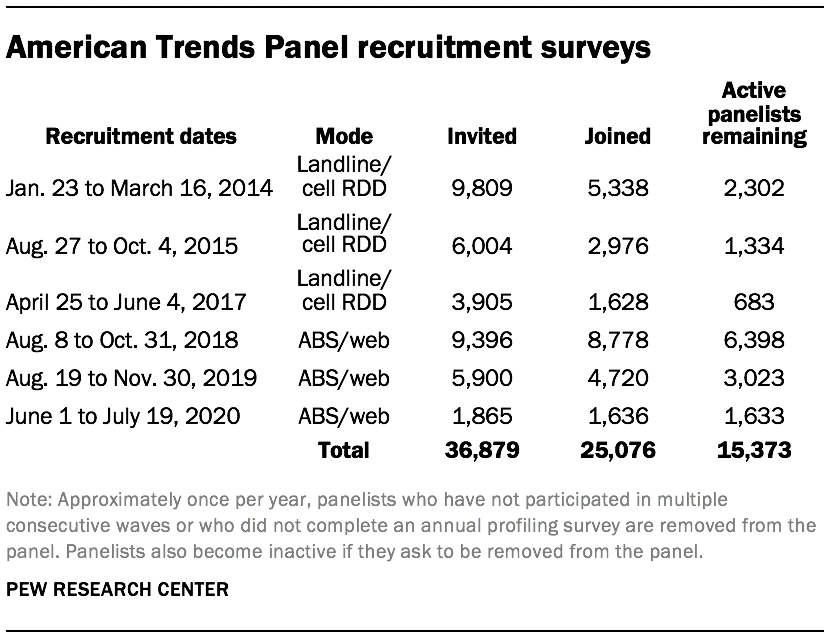
The ATP was created in 2014, with the first cohort of panelists invited to join the panel at the end of a large, national, landline and cellphone random-digit-dial (RDD) survey that was conducted in both English and Spanish. Two additional recruitments were conducted using the same method in 2015 and 2017, respectively. Across these three surveys, a total of 19,718 adults were invited to join the ATP, of which 9,942 agreed to participate.
In August 2018, the ATP switched from telephone to address-based recruitment. Invitations were sent to a random, address-based sample (ABS) of households selected from the U.S. Postal Service’s Delivery Sequence File. In each household, the adult with the next birthday was asked to go online to complete a survey, at the end of which they were invited to join the panel. For a random half-sample of invitations, households without internet access were instructed to return a postcard. These households were contacted by telephone and sent a tablet if they agreed to participate. A total of 9,396 were invited to join the panel, and 8,778 agreed to join the panel and completed an initial profile survey. The same recruitment procedure was carried out on Aug. 19, 2019, from which a total of 5,900 were invited to join the panel and 4,720 agreed to join the panel and completed an initial profile survey. Another recruitment using the same procedure was carried out on June 1, 2020, from which a total of 1,865 were invited to join the panel and 1,636 agreed to join the panel and completed an initial profile survey. Of the 25,076 individuals who have ever joined the ATP, 15,373 remained active panelists and continued to receive survey invitations at the time this survey was conducted.
The U.S. Postal Service’s Delivery Sequence File has been estimated to cover as much as 98% of the population, although some studies suggest that the coverage could be in the low 90% range.1 The American Trends Panel never uses breakout routers or chains that direct respondents to additional surveys.
Weighting
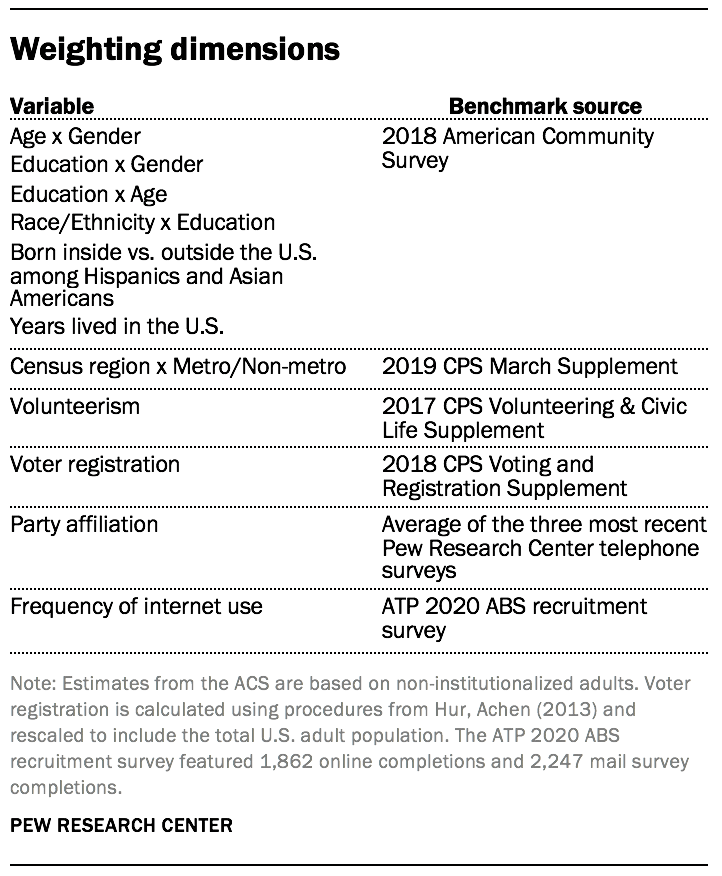
The ATP data was weighted in a multistep process that accounts for multiple stages of sampling and nonresponse that occur at different points in the survey process. First, each panelist begins with a base weight that reflects their probability of selection for their initial recruitment survey (and the probability of being invited to participate in the panel in cases where only a subsample of respondents were invited). The base weights for panelists recruited in different years are scaled to be proportionate to the effective sample size for all active panelists in their cohort. To correct for nonresponse to the initial recruitment surveys and gradual panel attrition, the base weights for all active panelists are calibrated to align with the population benchmarks identified in the accompanying table to create a full-panel weight.
For ATP waves in which only a subsample of panelists are invited to participate, a wave-specific base weight is created by adjusting the full-panel weights for subsampled panelists to account for any differential probabilities of selection for the particular panel wave. For waves in which all active panelists are invited to participate, the wave-specific base weight is identical to the full-panel weight.
In the final weighting step, the wave-specific base weights for panelists who completed the survey are again calibrated to match the population benchmarks specified above. These weights are trimmed (typically at about the 1st and 99th percentiles) to reduce the loss in precision stemming from variance in the weights. Sampling errors and test of statistical significance take into account the effect of weighting.
The following table shows the unweighted sample sizes and the error attributable to sampling that would be expected at the 95% level of confidence for different groups in the survey:
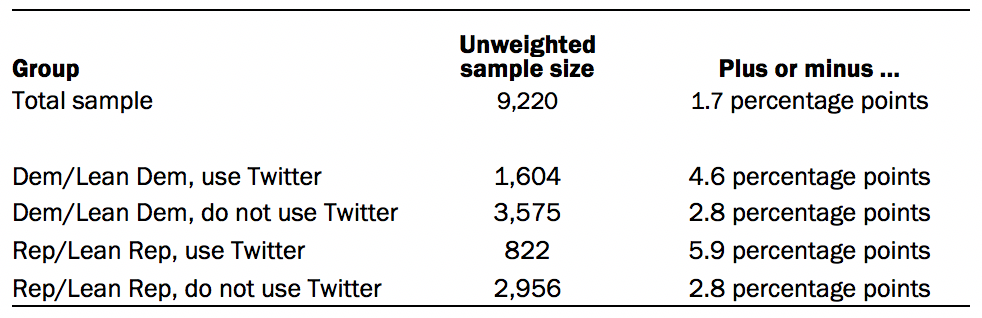
Sample sizes and sampling errors for other subgroups are available upon request. In addition to sampling error, one should bear in mind that question wording and practical difficulties in conducting surveys can introduce error or bias into the findings of opinion polls.
Twitter data methodology
Twitter handle collection
The analysis of Twitter use in this report is based on two surveys of U.S. adults ages 18 years and older. The first was a survey of Twitter users conducted from Nov. 21 to Dec. 17, 2018, by Ipsos in English using KnowledgePanel. The second was a nationally representative survey of U.S. adults (including both Twitter users and non-users) conducted from Oct. 29 to Nov. 11, 2019, on Pew Research Center’s American Trends Panel. This report focuses on the current day activity of 2,791 respondents from the KnowledgePanel survey and 1,345 respondents from the ATP survey who said they use Twitter, agreed to allow researchers to examine their Twitter behaviors, and provided a valid Twitter handle. The margin of sampling error for the combined sample of 4,136 Twitter users is plus or minus 2.4 percentage points.
The two surveys had different designs and eligibility criteria. For the KnowledgePanel survey, a total of 7,850 panelists who had previously indicated that they have a Twitter account were invited to participate. Of the 4,829 who responded, 3,649 (76%) confirmed that they used Twitter. Among confirmed Twitter users, 3,293 (90%) agreed to provide their Twitter handle. Next, researchers reviewed each account and removed any that were nonexistent or belonged to institutions, products or international entities. In the end, there were 2,791 respondents who both completed the survey and provided a valid handle (76% of confirmed Twitter users).
KnowledgePanel members are recruited through probability sampling methods and include those with internet access and those who did not have internet access at the time of their recruitment (KnowledgePanel provides internet access for those who do not have it, and if needed, a device to access the internet when they join the panel). A combination of RDD and ABS methodologies have been used to recruit panel members. (In 2009 KnowledgePanel switched its sampling methodology for recruiting members from RDD to ABS.) KnowledgePanel continually recruits new panel members throughout the year to offset panel attrition.
The ATP sample is comprised of adults who responded to ATP Wave 57. A total of 12,043 panelists responded out of 14,412 who were sampled, for a response rate of 84%.2 On this survey, a total of 2,561 (21%) stated that they used Twitter. Of these Twitter users, 1,517 (59%) agreed to provide their Twitter handle. Researchers reviewed each account in a similar manner as for the KnowledgePanel respondents. This yielded 1,345 Twitter users who agreed to participate in the study and provided a valid handle (53% of confirmed Twitter users).
Weighting
The final sample of 4,136 Twitter users with valid handles was weighted in a multi-stage process. Both the KnowledgePanel and ATP samples begin with a base weight that reflects each respondent’s probability of selection into the sample. In the first step, a propensity adjustment was made to the ATP sample’s base weight so that the adjusted ATP sample more closely resembled the KnowledgePanel sample on gender, age, race, Hispanic ethnicity, education, region, party affiliation, volunteerism, voter registration, and metropolitan area. In addition to demographics, the propensity adjustment also balanced on whether panelists tweeted at least once between Oct. 28, 2019, and April 28, 2020, the number of tweets in that six month period, the number of followers, the number of accounts followed, and the number of tweets favorited per day. This was done to adjust for differences between the two samples in terms of the frequency of Twitter use that are likely attributable to differences in the design, timing and incentivization of the two surveys.
Next, the samples were combined and the weights were further adjusted using an iterative technique to match a set of benchmarks for gender, age, race, Hispanic ethnicity, education, region, party affiliation, volunteerism, voter registration, and metropolitan area. Because there are no official benchmarks for the population of Twitter users, population parameters were estimated using the set of respondents to ATP Wave 57 who indicated that they use Twitter (regardless of whether they agreed to provide their Twitter handle). For details on how the full Wave 57 sample was weighted see the survey methodology.
Sampling errors and statistical tests of significance take into account the effect of weighting at each of these stages. In addition to sampling error, question wording and practical difficulties in conducting surveys can introduce error or bias into the findings of opinion polls.
Data collection
Respondents with valid accounts were loaded into a secure database. Researchers regularly collect and record the publicly available data from these accounts. This includes only profile description, number of tweets, and number of followers and followed accounts for users with protected accounts. This includes the tweets and the list of accounts followed by and following each user for accounts that are not protected. This study only includes data about users that do not protect their accounts, whose accounts are public.
Tweets and general profile data were collected daily, and the lists of followed and following accounts once a week. The weekly collection is staggered for the two sets of survey respondents to avoid hitting limits on querying the Twitter API.
The tweets analyzed in this study were produced between Nov. 11, 2019, and Sept. 14, 2020. The general profile information, such as number of followers, is from Sept. 14, 2020. Data about accounts followed by respondents to the ATP survey was collected between Sept. 6 and Sept. 7, 2020, and to the KnowledgePanel survey between Sept. 10 and Sept. 12, 2020. Monthly tweet frequency was estimated by multiplying the daily tweet count by 30 to approximate the monthly tweet total. Analyses of mentions and hashtags exclude retweets, but include original tweets, replies, and the original text on quote tweets. Mentions and hashtags are identified using a regular expression identifying the @ or # before the term, and transformed to lowercase before analysis. Hashtags less than two characters in length were excluded from analysis. In identifying the most followed accounts, center researchers were unable to identify a current twitter account associated with the twitter ID for two accounts. These accounts were dropped from the analysis.
© Pew Research Center, 2020
