In recent years, Pew Research Center has transitioned from probability-based telephone surveys to the American Trends Panel, a probability-based online panel. The transition from phone surveys conducted with an interviewer to online self-administered surveys brings with it the possibility of mode differences – differences arising from the method of interviewing.
This appendix includes opinion measures about trust in the federal government, feeling toward the federal government and views of the size of government. These questions, which have long-standing telephone trends, were included on an American Trends Panel (ATP) survey conducted at the end of July and the beginning of August and on a roughly contemporaneous telephone survey.
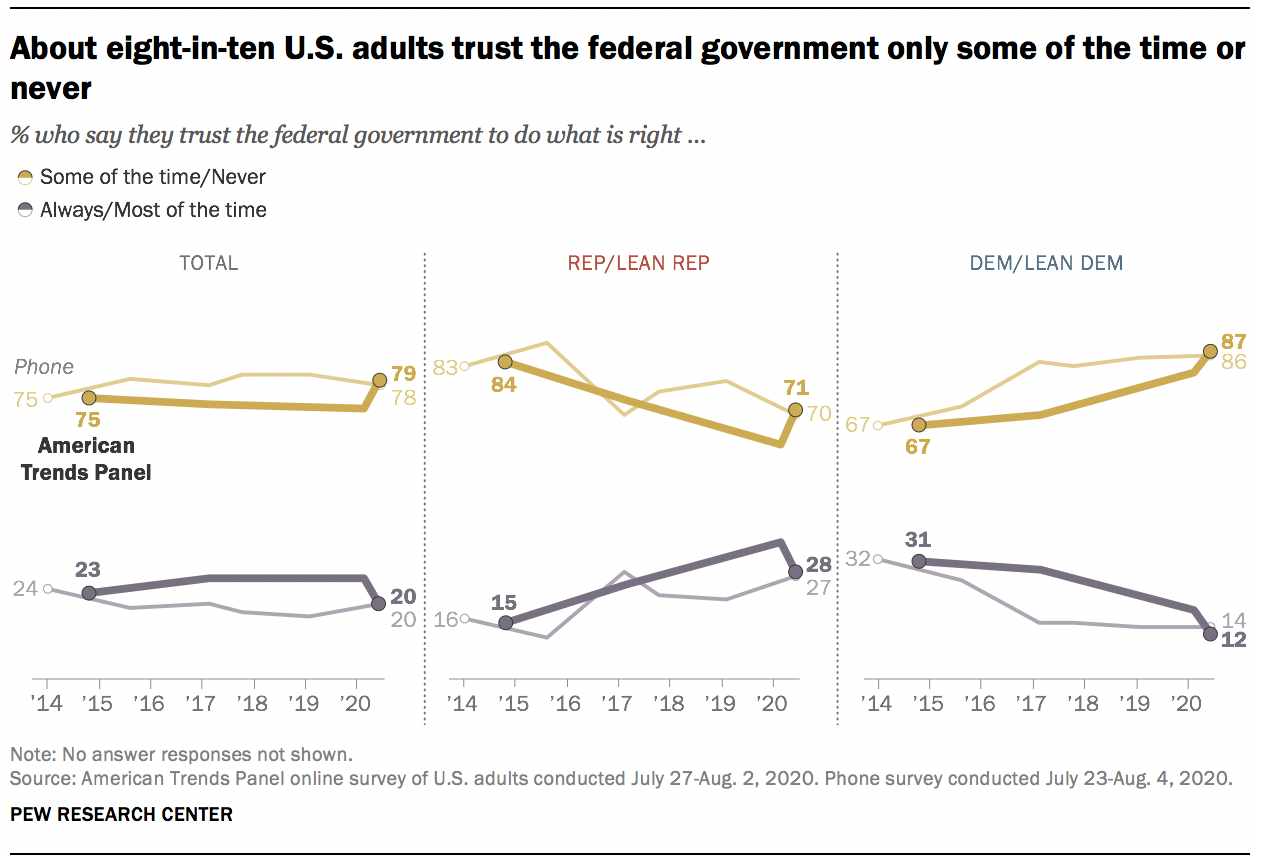
In the online survey, 20% say they trust the federal government to do what is right just about always or most of the time, while 79% say they trust the federal government some of the time or never. This is nearly identical to views on the phone survey (20% to 78%). This consistency between the telephone and online surveys is also the case within partisan groups.
Because trust in government as measured on the ATP has closely tracked trust measured on phone surveys since the Center began asking about trust online nearly six years ago, we are transitioning from using phone data to track this key trend to using ATP data beginning with surveys conducted during the current year. (The long-term trends illustrated in the main report and accompanying interactive include data from Pew Research, National Election Studies, Gallup, ABC/Washington Post, CBS/New York Times, and CNN.)
Feeling toward the federal government has also been highly consistent on contemporaneous surveys conducted online and by phone. In the most recent ATP survey, 18% of U.S. adults say they are basically content with the federal government, compared with 57% who say they are frustrated and 24% who say they are angry. In the phone survey conducted at the same time, 19% say they are basically content, 54% say they are frustrated and 24% say they are angry. Views on this question are also nearly identical within partisan groups across the two survey modes.
Another long-standing phone trend asks whether U.S. adults prefer a smaller government providing fewer services or a bigger government providing more services. The American Trends Panel survey finds that 52% say they prefer a bigger government, compared with 45% who prefer a smaller government.
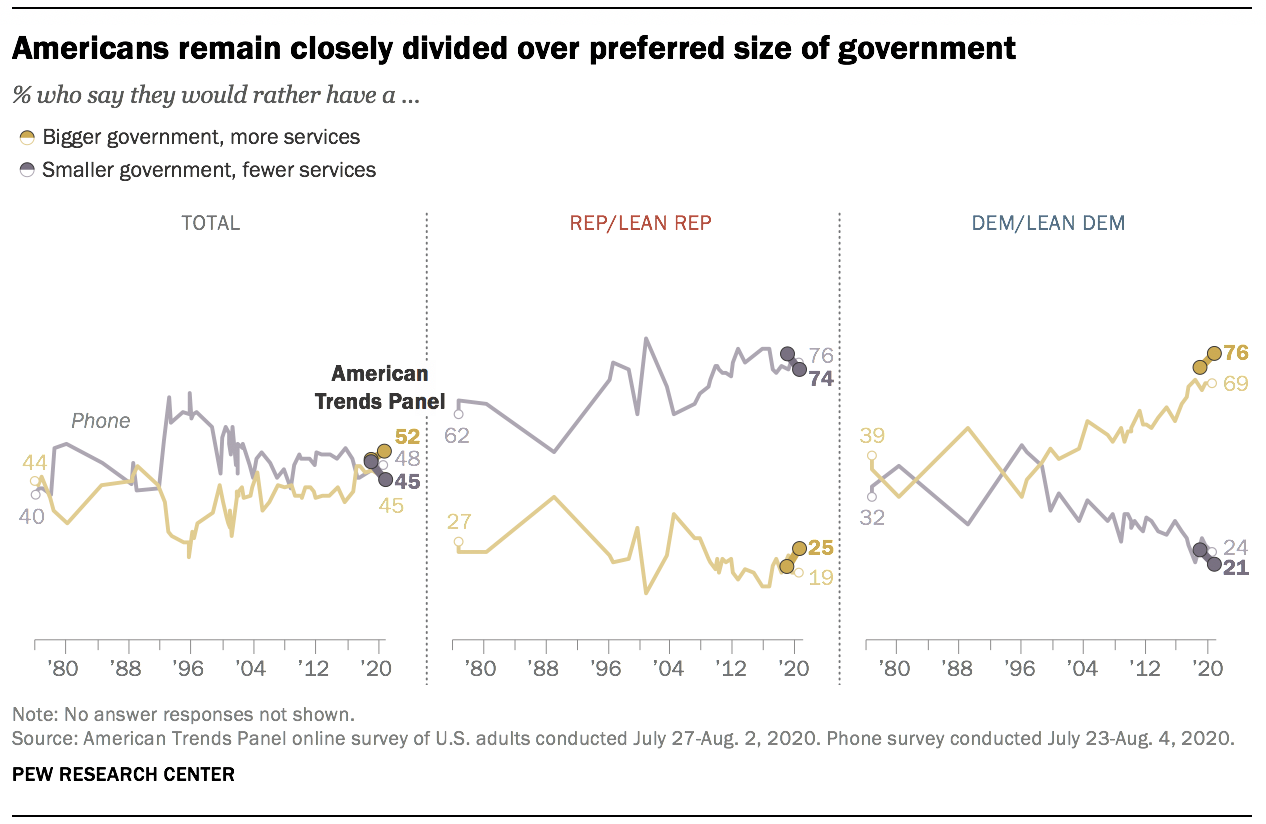
The contemporaneous phone survey shows a closer divide, with 45% saying they prefer a bigger government and 48% saying they prefer a smaller government. Both Republicans and Democrats are somewhat more likely to say they prefer a bigger government that provides more services online than on the phone. One-quarter of Republican American Trends Panel members say they prefer a bigger government, compared with 19% of Republicans in the phone survey. Among Democrats, 76% say they prefer a bigger government in the online survey versus 69% in the phone survey.