
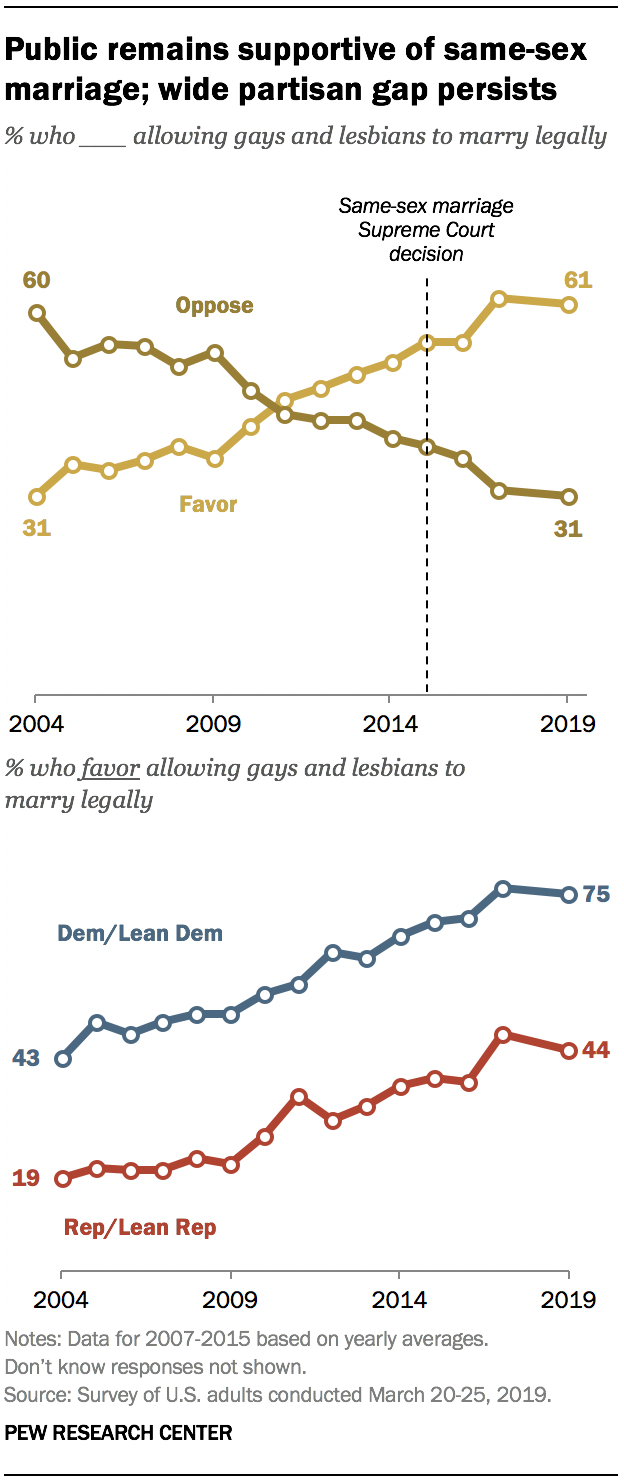
After years of generally steady increases, opinions about same-sex marriage are mostly unchanged since 2017. Today, a majority of Americans (61%) favor allowing gays and lesbians to marry legally, while about half as many (31%) oppose same-sex marriage.
While attitudes about same-sex marriage are changed little from two years ago, support has increased substantially over the past two decades. In 2004, opinion was almost the reverse of what it is today: 60% opposed same-sex marriage, while just 31% were in favor.
The Pew Research Center survey, conducted March 20-25 among 1,503 adults finds that Republicans and Democrats remain deeply divided over legal marriage for gays and lesbians – though support has increased significantly in both parties over the past 15 years.
Today, three-quarters of Democrats and Democratic-leaning independents favor same-sex marriage, up from 43% 15 years ago. By contrast, fewer than half of Republicans and Republican leaners (44%) support same-sex marriage; in 2004, just 19% of Republicans supported it.
Support for same-sex marriage also has increased among nearly all demographic groups over the past 15 years, including across generations and by religious affiliation:
- Support for same-sex marriage is highest among Millennials (74%) – as has generally been the case for nearly a decade. A majority of Gen Xers (58%) support allowing gays and lesbians to marry legally, as do about half of Boomers (51%) and 45% of the Silent Generation.
- Among religious groups, majorities of Catholics (61%), white mainline Protestants (66%) and the religiously unaffiliated (79%) say they support same-sex marriage. By contrast, just 29% of white evangelical Protestants favor same-sex marriage, while about twice as many (63%) are opposed.
Continue exploring attitudes about same-sex marriage.
[semantic_toggle_content_setup titles=”Overall, Leaned party, Detailed party, Party and ideology” id=”political-views” style=”pills” pill_size=”tiny”]
[semantic_toggle_content_tab id=”political-views”]
[semantic_toggle_content_tab id=”political-views”]
[semantic_toggle_content_tab id=”political-views”]
[semantic_toggle_content_tab id=”political-views”]


