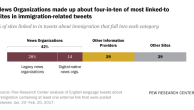
The News Interest Index is a weekly survey conducted by the Pew Research Center for the People & the Press aimed at gauging the public’s interest in and reaction to major news events. This project has been undertaken in conjunction with the Project for Excellence in Journalism’s News Coverage Index, an ongoing content analysis of the news. The News Coverage Index catalogues the news from top news organizations across five major sectors of the media: newspapers, network television, cable television, radio and the internet. Each week (from Monday through Sunday) PEJ compiles this data to identify the top stories for the week. (For more information about the Project for Excellence in Journalism’s News Coverage Index, go to www.pewresearch.org/pewresearch-org/journalism.) The News Interest Index survey collects data from Thursday through Sunday to gauge public interest in the most covered stories of the week.
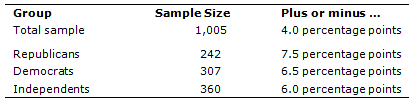
Results for this survey are based on telephone interviews conducted March 8-11, 2012, among a national sample of 1,005 adults 18 years of age or older living in the continental United States (602 respondents were interviewed on a landline telephone, and 403 were interviewed on a cell phone, including 199 who had no landline telephone). The survey was conducted by interviewers at Princeton Data Source under the direction of Princeton Survey Research Associates International. A combination of landline and cell phone random digit dial samples were used; both samples were provided by Survey Sampling International. Interviews were conducted in English. Respondents in the landline sample were selected by randomly asking for the youngest adult male or female who is now at home. Interviews in the cell sample were conducted with the person who answered the phone, if that person was an adult 18 years of age or older.
The combined landline and cell phone sample are weighted using an iterative technique that matches gender, age, education, race, Hispanic origin and region to parameters from the March 2011 Census Bureau’s Current Population Survey and population density to parameters from the Decennial Census. The sample is also weighted to match current patterns of telephone status based on extrapolations from the 2011 National Health Interview Survey. The weighting procedure also accounts for the fact that respondents with both landline and cell phones have a greater probability of being included in the combined sample and adjusts for household size within the landline sample. Sampling errors and statistical tests of significance take into account the effect of weighting. The following table shows the sample sizes and the error attributable to sampling that would be expected at the 95% level of confidence for different groups in the survey:
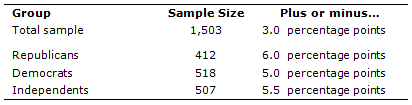
Some of the analysis in this report is based on telephone interviews conducted March 7-11, 2012, among a national sample of 1,503 adults, 18 years of age or older, living in all 50 U.S. states and the District of Columbia (900 respondents were interviewed on a landline telephone, and 603 were interviewed on a cell phone, including 310 who had no landline telephone). The survey was conducted by interviewers at Princeton Data Source under the direction of Princeton Survey Research Associates International. A combination of landline and cell phone random digit dial samples were used; both samples were provided by Survey Sampling International. Interviews were conducted in English and Spanish. Respondents in the landline sample were selected by randomly asking for the youngest adult male or female who is now at home. Interviews in the cell sample were conducted with the person who answered the phone, if that person was an adult 18 years of age or older. For detailed information about our survey methodology, see https://www.pewresearch.org/politics/methodology/
The combined landline and cell phone sample are weighted using an iterative technique that matches gender, age, education, race, Hispanic origin and nativity and region to parameters from the March 2011 Census Bureau’s Current Population Survey and population density to parameters from the Decennial Census. The sample also is weighted to match current patterns of telephone status and relative usage of landline and cell phones (for those with both), based on extrapolations from the 2011 National Health Interview Survey. The weighting procedure also accounts for the fact that respondents with both landline and cell phones have a greater probability of being included in the combined sample and adjusts for household size within the landline sample. Sampling errors and statistical tests of significance take into account the effect of weighting. The following table shows the sample sizes and the error attributable to sampling that would be expected at the 95% level of confidence for different groups in the survey:
Sample sizes and sampling errors for other subgroups are available upon request.
In addition to sampling error, one should bear in mind that question wording and practical difficulties in conducting surveys can introduce error or bias into the findings of opinion polls.