ABOUT THE VALUES SURVEY DATA
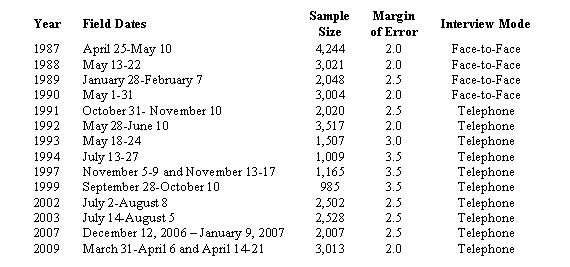
The values project draws on a series of large national surveys conducted since 1987. The project was initiated by the Times Mirror Center for the People & the Press in 1987 and continued by the Pew Research Center for the People & the Press since 1996. Over this period, 14 surveys have been conducted with a total of 32,570 interviews. In the 2009 survey, interviews included 77 questions about political and social values, plus questions about current issues and political figures. Surveys since 2003 include interviews conducted in English and Spanish.

Results for the 2009 values survey are based on telephone interviews conducted under the direction of Princeton Survey Research Associates among a nationwide sample of 3,013 adults, 18 years of age or older, from March 31-April 6, 2009 and April 14-21, 2009 (2,260 respondents were interviewed on a landline telephone, and 753 were interviewed on a cell phone, including 271 who had no landline telephone). Interviews were conducted in English and Spanish. Both the landline and cell phone samples were provided by Survey Sampling International.
The following table shows the error attributable to sampling that would be expected at the 95% level of confidence for different groups in the 2009 survey:
| Group | Sample Size | Plus or minus… |
| Total sample | 3,013 | 2.0 percentage points |
| Survey A | 1,506 | 3.0 percentage points |
| Survey B | 1,507 | 3.0 percentage points |
| Form 1 | 1,492 | 3.0 percentage points |
| Form 2 | 1,521 | 3.0 percentage points |
| Republicans | 735 | 4.0 percentage points |
| Democrats | 936 | 4.0 percentage points |
| Independents | 1,184 | 3.5 percentage points |
In addition to sampling error, one should bear in mind that question wording and practical difficulties in conducting surveys can introduce error or bias into the findings of opinion polls.
Figures in this report may not add to 100% due to rounding. References to white respondents include only non-Hispanic whites, blacks include only non-Hispanic blacks, Hispanics may be of any race.
SURVEY METHODOLOGY IN DETAIL
The typical Pew Research Center for the People & the Press national survey selects a random digit sample of both landline and cell phone numbers in the continental United States. As the proportion of Americans who rely solely or mostly on cell phones for their telephone service continues to grow, sampling both landline and cell phone numbers helps to ensure that our surveys represent all adults who have access to either. We sample landline and cell phone numbers to yield a ratio of approximately three landline interviews to each cell phone interview. This ratio is based on an analysis that attempts to balance cost and fieldwork considerations as well as to improve the overall demographic composition of the sample (in terms of age, race/ethnicity and education). This ratio also ensures a minimum number of cell only respondents in each survey.
The design of the landline sample ensures representation of both listed and unlisted numbers (including those not yet listed) by using random digit dialing. This method uses random generation of the last two digits of telephone numbers selected on the basis of the area code, telephone exchange, and bank number. A bank is defined as 100 contiguous telephone numbers, for example 800-555-1200 to 800-555-1299. The telephone exchanges are selected to be proportionally stratified by county and by telephone exchange within the county. That is, the number of telephone numbers randomly sampled from within a given county is proportional to that county’s share of telephone numbers in the U.S. Only banks of telephone numbers containing three or more listed residential numbers are selected.
The cell phone sample is drawn through systematic sampling from dedicated wireless banks of 100 contiguous numbers and shared service banks with no directory-listed landline numbers (to ensure that the cell phone sample does not include banks that are also included in the landline sample). The sample is designed to be representative both geographically and by large and small wireless carriers.
Both the landline and cell samples are released for interviewing in replicates, which are small random samples of the larger sample. Using replicates to control the release of telephone numbers ensures that the complete call procedures are followed for the entire sample. The use of replicates also ensures that the regional distribution of numbers called is appropriate. This also works to increase the representativeness of the sample.
When interviewers reach someone on a landline phone, they ask to speak with “the youngest male, 18 years of age or older, who is now at home.” If there is no eligible male at home, interviewers ask to speak with “the youngest female, 18 years of age or older, who is now at home.” This method of selecting respondents within each household improves participation among young people who are often more difficult to interview than older people because of their lifestyles. Unlike a landline phone, a cell phone is assumed in Pew Research polls to be a personal device. For those in the cell sample, interviewers ask if the person who answers the cell phone is 18 years of age or older to determine if the person is eligible to complete the survey but no request is made to interview other household members.
Sampling error results from collecting data from some, rather than all, members of the population. For each of our surveys, we report a margin of sampling error for the total sample and sometimes for key subgroups analyzed in the report (e.g., registered voters, Democrats, Republicans, etc.). For example, the sampling error for a typical Pew Research Center for the People & the Press national survey of 1500 completed interviews is plus or minus 3 percentage points with a 95% confidence interval. This means that in 95 out of every 100 samples of the same size and type, the results we obtain would vary by no more than plus or minus 3 percentage points from the result we would get if we could interview every member of the population. Thus, the chances are very high (95 out of 100) that any sample we draw will be within 3 points of the true population value.
At least 7 attempts are made to complete an interview at every sampled telephone number. The calls are staggered over times of day and days of the week (including at least one daytime call) to maximize the chances of making contact with a potential respondent. Interviewing is also spread as evenly as possible across the field period. An effort is made to recontact all interview breakoffs and refusals in order to attempt to convert them to completed interviews.
Response rates for current Pew Research polls range from 18 to 25%; these response rates are comparable to those for other major polls. The response rate is the percentage of known or assumed residential households where a completed interview was obtained. The response rate we report is equivalent to the American Association for Public Opinion Research’s (AAPOR) Response Rate 3 (RR3). Fortunately, low response rates are not necessarily an indication of nonresponse bias. Nonresponse in telephone interview surveys can produce biases in survey-derived estimates. Survey participation tends to vary for different subgroups of the population, and these subgroups are likely to also vary on questions of substantive interest. In order to compensate for these known biases, the sample data are weighted for analysis.
The combined landline and cell phone sample is first weighted to account for the fact that respondents with both landline and cell phones have a greater probability of being included in the sample. Respondents with only a landline or only a cell phone are given a weight of 1, respondents with both a landline and cell phone are given a weight of .5 and respondents whose phone status is unknown are given an average weight for the sample based on which phone we reached them on.
The sample is then weighted using population parameters for all households with adults 18 years of age or older from the U.S. Census Bureau. The parameters for age, education, race/ethnicity, and region are from the Current Population Survey’s March 2008 Annual Social and Economic Supplement and the parameter for population density is from the Decennial Census. These population parameters are compared with the sample characteristics to construct the weights. In addition to the demographic parameters, the sample is also weighted to match current patterns of telephone status and relative usage of landline and cell phones (for those with both), based on extrapolations from the July-December 2007 National Health Interview Survey. The final weights are derived using an iterative technique that simultaneously balances the distributions of all weighting parameters.
Weighting cannot eliminate every source of nonresponse bias. Nonetheless, properly-conducted public opinion polls have a good record in achieving unbiased samples. In particular, election polling – where a comparison of the polls with the actual election results provides an opportunity to validate the survey results – has been very accurate over the years.
ABOUT THE PARTY IDENTIFICATION DATABASE
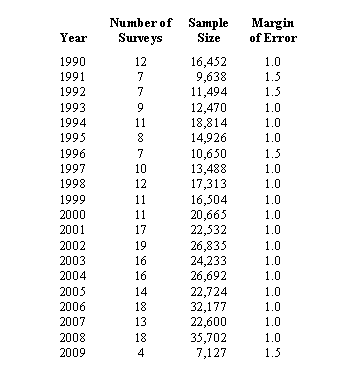
The analysis of changes in party identification over time is based on a compilation of 240 surveys and more than 380,000 interviews among the general public conducted by the Pew Research Center from January 1990 to April 2009. These surveys are combined into one large data file that can be sorted according to a range of demographic characteristics, with comparisons made across different time periods. Yearly totals are calculated by combining all surveys for the calendar year, with appropriate weights applied. The table below shows the number of surveys and interviews conducted each year as well as the margin of error for each yearly sample.

Long term trends in party identification from 1939 to 1989 were compiled from surveys conducted by the Gallup Organization as archived in the Gallup Brain database searching for the standard phrases “consider yourself a Republican” or “consider yourself a Democrat” coupled with the word “independent” to exclude any surveys that did not offer an explicit independent option. Yearly averages are computed by taking the simple average of the percent Republican, Democrat and independent across all surveys available in each calendar year. The questions used to identify party identification in Gallup surveys prior to 1955 varied but are roughly comparable. Since 1955 the Gallup question has been standardized and is identical to the one used by the Pew Research Center.