
The United States remains a highly religious nation. A large majority of Americans say they belong to a particular faith, and similarly large numbers express agreement with statements about key religious beliefs and behaviors. There have been only modest changes in the level of agreement with these statements over the past decade. About eight-in-ten (83%) say they never doubt the existence of God, and comparable percentages agree that prayer is an important part of their life (78%), and that “we will all be called before God at the Judgment Day to answer for our sins” (78%).
The percentage of Americans agreeing with all three statements has changed very little since the first Pew Research values survey in 1987. That year, 68% of respondents agreed with all three; this year, 69% do so. There has been a modest increase over this period in what might be considered enthusiastic religious expression: the percentage who completely agree with all three statements rose from 33% 1987 to 44% by 1994; this year 40% completely agree with all three.
Yet despite the strongly religious character of the United States, the share of Americans who do not affiliate with a religious tradition has been growing (see Feb. 2008 “The U.S. Religious Landscape”). Overall, 16% of Pew Research respondents interviewed in 2009 say they are atheist, agnostic or “nothing in particular.” Generational change is the principal mechanism driving this growth. Among those in the Millennial age cohort, or Generation Y – Americans born after 1976 – 25% are not affiliated with a religious tradition. By comparison, among Baby Boomers just 13% are unaffiliated.
In both the 2006 and 2008 elections, religiously unaffiliated and secular voters had a significant impact on the outcome, boosting the fortunes of Democratic candidates at the state and national levels. Currently, 17% of Democrats and 21% of independents are unaffiliated, compared with just 7% of Republicans. Fewer Democrats and independents are regular churchgoers as well: nearly half of Democrats (48%) and 52% of independents attend worship services only a few times a year or less often; the figure for Republicans is 33%. Looked at another way, more than half of Republicans (52%) attend church at least once a week, compared with 36% of Democrats and 32% of independents.
Democrats and independents also are less likely than Republicans to express agreement with traditional religious beliefs, though solid majorities of both groups do so. The percentage of Democrats agreeing with all three statements about religious belief and practice fell sharply after 1999 (from 76% that year to 62% in 2007), but rose over the past two years to 68%. Currently, 75% of Republicans agree with all three statements, down slightly from 2007 when 79% agreed with all three. Somewhat fewer independents express agreement (66% now agree with all three statements).
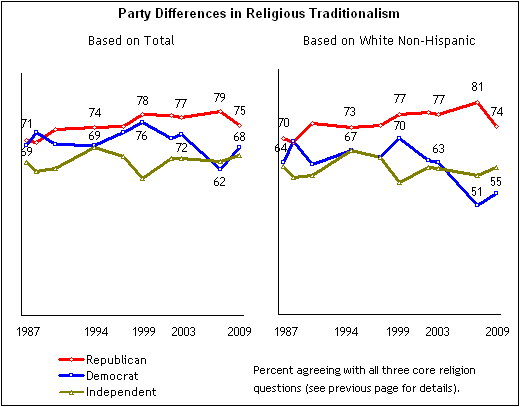
The Democratic Party is much more racially diverse than the Republican Party, and this diversity affects the overall levels of religiosity expressed by Democrats. African-Americans are far more likely than whites to agree with all three statements (91% of non-Hispanic blacks did so in 2009, compared with 65% of non-Hispanic whites). The partisan gap in religiosity is considerably larger when considering only non-Hispanic white respondents, with just 57% of white Democrats expressing agreement with all three statements. This compares with 74% of white Republicans and 63% of white independents.
Trends in Traditional Values
Religious beliefs also shape many kinds of values that citizens hold. In particular, social values such as views about homosexuality, women’s roles, the nature of good and evil, and family and marriage have strong connections to religiosity. Even though there has been little change in the number of Americans holding strong religious beliefs, the percentage with conservative views on social values has been steadily declining over the past two decades.
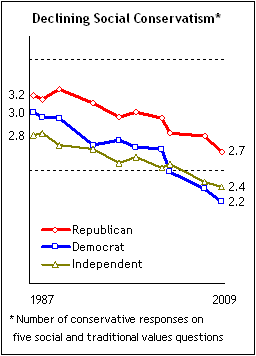
The average number of conservative responses on an index of five social values has dropped from 3.0 in 1987 to 2.4 this year. Put another way, the percentage of respondents giving three or more conservative responses has declined from 62% in 1987 to 46% in 2009.
As with religiosity, Republicans are more likely than Democrats and independents to hold socially conservative views. On average this year, Republicans gave 2.7 conservative responses on the index of five items, while Democrats gave 2.2 and independents 2.4 conservative responses. But the rate of decline in conservatism has
been about equal across party lines. Republicans are less conservative now than they were in 1987, and the same is true for Democrats and independents.
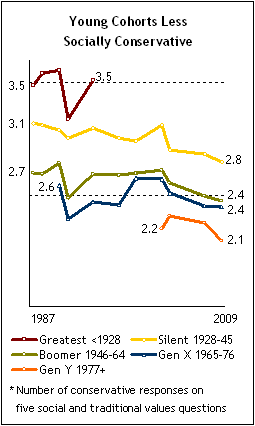
Much of the decline in social conservatism is a result of generational change. Younger age cohorts are less conservative than older ones, with Baby Boomers significantly less conservative than the Silent Generation and its predecessors, and Generation Y considerably less conservative than either the Baby Boomers or Generation X. Within age cohorts, the change over time in social conservatism is very modest, indicating that the societal change in these values is mostly a function of newer generations replacing older ones.
Looking at the individual items that make up the scale of social conservatism, there has been a relatively gradual change in a less conservative direction. Four of the items are shown here; a fifth is in the next section.
For each item, certain demographic patterns are evident. For all five, white evangelical Protestants are the most conservative religious group, with the unaffiliated least likely to express a conservative opinion. Better educated respondents tend to be less conservative than those with less education. And younger respondents tend to be less conservative than older ones. For the most part, there are modest gender differences in opinions about these items.
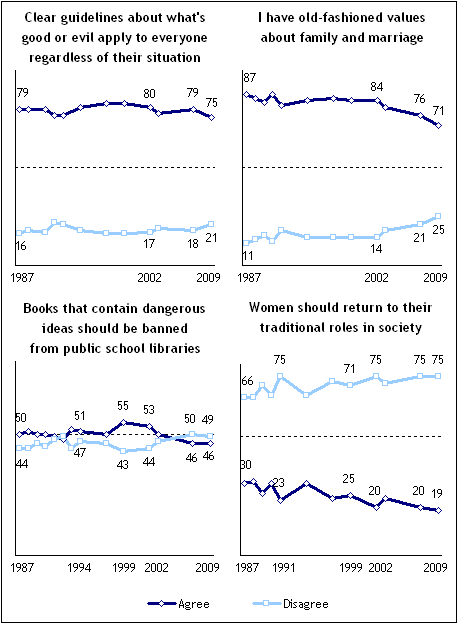
When it comes to whether “women should return to their traditional roles in society,” three-quarters (75%) of Americans disagree, including roughly equal shares of Republicans, Democrats and independents. Democratic opinion is much more intense, however. The percentage of Democrats who completely disagree with this statement (62%) is 14 points higher than the percentage of Republicans who take that position (48%). Age differences on this item also are sizable. While two-thirds of those younger than 30 completely disagree with the notion that women should return to their traditional roles, fewer than half of those 65 and older (43%) completely disagree. Interestingly, there is no gender gap when it comes to this question (75% of both men and women disagree.)
A somewhat different pattern is seen on the question of whether “books that contain dangerous ideas should be banned from public school libraries.” Overall there has been only a small decline in the percentage agreeing with this statement. There are no differences in agreement by party. Generation Y, which tends to be liberal on most of the other social values questions, is about as likely to agree with the statement as the Baby Boomers or Generation X. Members of older cohorts have consistently been more likely to agree.
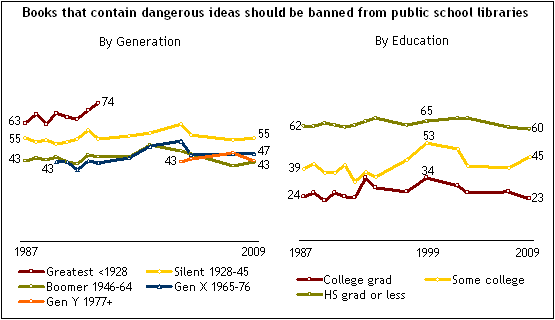
The largest and most persistent differences on this question are by level of education: 23% of college graduates agree with the statement, compared with 45% of those with some college experience and 60% of those who have a high school education or less. These differences are just as large as they were in 1987, when the question was first asked.
Attitudes about Homosexuality and Same-Sex Marriage
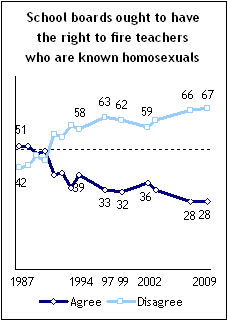
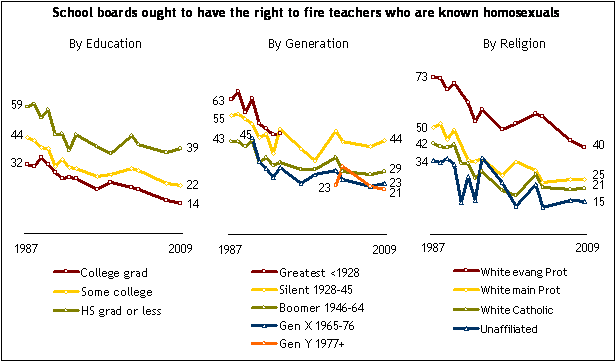
Over the past two decades, the most extensive change in the five traditional values has occurred on the item asking if “school boards ought to have the right to fire teachers who are known homosexuals.” The percentage agreeing with this statement has fallen from 51% in 1987 to 28% today. Two-thirds of respondents (67%) disagree, including 41% who completely disagree. Partisan differences on the question are relatively modest, with just 32% of Republicans agreeing, compared with 26% and 27% of Democrats and independents, respectively. There also are only small differences by race, with 26% of whites and 33% of blacks agreeing.
Larger differences are evident when comparing college graduates with those who have a high school education or less, and white evangelicals are much more apt to agree than are members of other religious traditions. But even among white evangelicals, the percentage supporting the right to fire homosexual teachers has fallen a great deal over the 22-year period. In 1987, 73% of white evangelicals agreed; now 40% do so. Much of the change within nearly all groups occurred between 1987 and 1993, when the overall percentage agreeing with the statement fell from 51% to 34%. The decline since then has been more gradual. Generational replacement has been an important factor, with a 23-point difference in the level of agreement comparing members of the Silent Generation with those of Generation Y.
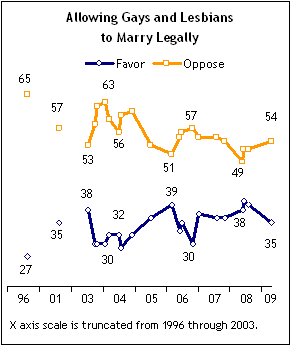
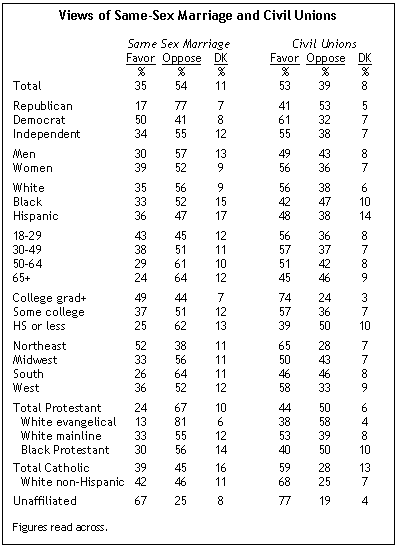
While the issue of homosexual teachers is less controversial now than it was 20 years ago, the issue of same-sex marriage has occupied center stage politically for the past several years. Maine recently became the fifth state to legalize same-sex marriage, and legislative efforts to pass similar laws are underway in other states as well. But a majority of the public (54%) remains opposed to same-sex marriage, reflecting a small but significant increase in opposition since November 2007, when 49% opposed it. Just 35% favor it. However, the legislative action in states such as Vermont, New Hampshire and Maine is not inconsistent with public opinion in New England or the Northeast more generally. New England respondents favor same-sex marriage by a margin of 55% to 39%, while those in the greater Northeast region support it by 52% to 38%.
Very few Republicans (17%) favor same-sex marriage; 77% of Republicans are opposed. Democrats are more divided on the question, with half (50%) in favor and 41% opposed. Independents divide about the same way as the public overall: 34% favor same-sex marriage and 55% oppose it.
Some of the largest differences on the question occur among religious groups. White evangelicals are the least supportive of any demographic group, with just 13% in favor and 81% opposed, including 54% who strongly oppose it. Among Catholics, 39% favor it and 45% are opposed. Two-thirds of the unaffiliated (67%) favor same-sex marriage.
In contrast with same-sex marriage, a slight majority of the public (53%) supports civil unions, described to respondents as “allowing gay and lesbian couples to enter into legal agreements with each other that would give them many of the same rights as married couples”; 39% oppose civil unions.
Social Values Less Politically Potent Than In 2004
Not only has there been a slow decline in the number of Americans with socially conservative values, the political importance of those values has also diminished as concerns about the economy have grown. In the 2004 presidential election, both the National Election Pool’s exit poll and a Pew Research Center post-election survey that year found a plurality of voters naming “moral values” as the most important issue in their vote. The Pew survey found 27% picking moral values as their top issue from a list of seven, and 36% picked it either first or second. The economy and jobs finished behind moral values, with 21% mentioning it first and 44% choosing it first or second.
Respondents to the new values survey were asked the same question regarding a hypothetical presidential election today. Only 10% picked moral values first; not surprisingly, five times as many (50%) chose the economy and jobs. Even including first and second mentions, just 16% selected moral values; more than two-thirds (69%) picked the economy and jobs.
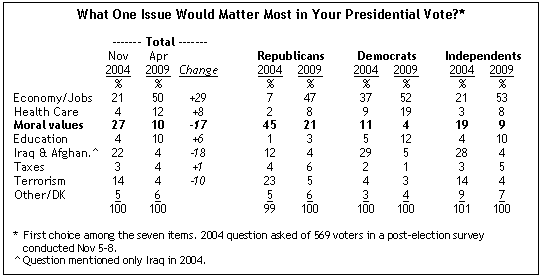
The decline in the importance of moral values as an issue in a possible election has come across the board, but the drop has been especially large among Republicans and working-class voters. In 2004, 45% of Republicans cited moral values as their top issue; now just 21% do so, compared with 47% who mention the economy and jobs. For Democrats, the percentage citing moral values declined from 11% in 2004 to just 4% now. For independents, it dropped from 19% to 9%.
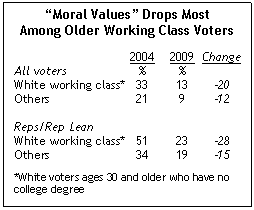
Similarly, among white voters ages 30 and older who have not completed college, the percentage naming moral values dropped 20 points over the period. Among other voters, the decline was 12 points. Among Republicans and Republican leaning voters, the difference was even greater. Slightly more than half (51%) of older white working class Republicans and leaners cited moral values in 2004; now just 23% do so. Among other Republicans, the decline was much less steep, from 34% in 2004 to 19% today.