Summary of Findings
The public continues to be wary in its assessments of the health of the U.S. economy, despite recent improvement in some key economic indicators. Only about one-in-three Americans think the national economy is in good shape, and optimism about the future is markedly lower than it has been over the past three years. Closer to home, the percentage of the public rating its own financial situation positively has declined since the beginning of the year from 51% to 44%.
No single factor explains this cautious outlook. Instead, the public’s economic unease appears to reflect a variety of concerns, both personal and national in scope. There is a broad consensus that gas prices are a significant problem for the nation, and the federal budget deficit also looms as a major source of anxiety.
Yet the polling identifies several other sources of financial worry. Public perceptions of local job availability remain highly negative, despite recent improvements in the national employment picture. While people with low household incomes are most troubled by financial problems of all types, including job shortages, about half of those with annual incomes above $75,000 say that jobs are scarce in their community.
The latest national survey by the Pew Research Center for the People & the Press, conducted May 11-15 among 1,502 Americans, also finds a growing number of Americans, especially those living in the Northeast and West, believe that housing has become difficult to afford in their communities. One-in-four, including many at middle-income levels, also say they owe more in personal debt than they can afford.

An analysis of economic attitudes shows that, of all the financial concerns affecting the public, the availability of jobs and the instability of the stock market are the leading drivers of pessimism about the state of the economy. Although gas prices have provoked widespread concern, attitudes on this issue are less correlated with views of the overall economy. Virtually all Americans, optimists and pessimists alike, see gas prices as a major problem.
Two-thirds of the public (67%) now judge the economy to be in either only fair or poor shape, up from 60% at the start of the year. Pessimism about the future has risen even more sharply. The percentage predicting a worsening of the economy has risen from 9% last August, to18% in January, and 24% currently. Just 18% of the public believe that national economic conditions a year from now will be better than they are currently, a decline from 27% in January, and 36% in August 2004. Still, more than half (55%) expect economic conditions to remain stable, about the same number as earlier this year.

People’s evaluations of their personal financial situations remain much more optimistic than judgments about the national economy. But assessments of personal finances, too, are less favorable than in the recent past: 44% of Americans now rate their current financial circumstances as excellent or good, down from 51% in January.
Still, most Americans (61%) continue to say that their situation will improve at least somewhat over the next year. And while fewer than half of Americans are feeling bullish about the financial markets, six-in-ten of those who own stocks or mutual funds outside of a retirement account say that prospects for the stock markets are favorable.
Specific Concerns
Gasoline prices lead the public’s list of economic problems. Fully 85% of Americans cite gas prices as a very big (44%) or big (41%) problem for the nation’s economy.
Worries about the large and growing federal budget deficit claim second place, with three-in-ten (31%) citing the deficit as a very big problem and an additional 47% saying it is a big problem. The job situation is viewed as a very big problem by a quarter of Americans; another 46% cite it as a big problem. Concern about the trade deficit (rated a very big or big problem by 63% of the public) adds to the backdrop of national concern.
Jobs Still Difficult to Find

Despite growth over the last year in the number of jobs nationally, the survey also finds the percentage of the public complaining that jobs remain hard to find in their communities is now larger than a year ago. This complaint rose most sharply among those in households with incomes of less than $30,000 a year; three-quarters of this group say that jobs are hard to find locally.
But while job concerns among families in the middle-income ($30,000-$49,999) range are slightly lower than last August, worries among higher-income groups have increased. Even among the most affluent those with annual incomes of $75,000 and above about half (48%) express concern about their local job situation, perhaps reflecting discontent with the quality as much as the quantity of available jobs.
The general level of inflation ranks only fifth on the public’s worry list, but concerns about rising housing prices have increased. Only about half of Americans (49%) now judge that housing in their local community is affordable. Notably, concern about housing prices has risen sharply among those
with household incomes above $30,000 and below $75,000 a year.
On the more positive side, many people look to the stock market for important clues about the condition of the national economy, and, at least among active investors, the outlook is bullish. Overall, opinion about the market is divided: 45% say now is a good time to invest in the market, 40% say it’s a bad time to invest.
But these views are strongly related to whether a person is already in the market or not. Among people who currently hold stock or mutual funds but not those who have retirement accounts only views of the market are
positive: 60% say it’s a good time to invest, 32% a bad time. Among those not in the market, however, nearly half (49%) say it’s a bad time and just 29% say it’s good.
With interest rates remaining relatively low, they are not generally cited as a major problem. Still, significant numbers of people say they have more debt than they can afford. The problem is, unsurprisingly, most acute among low-income families, 37% of whom feel unable to shoulder their current burden of debt. But more than a quarter of families with incomes between $30,000 and $75,000 also say that their obligations exceed
their means.
Deciphering the Economic Doldrums
Overall, more than eight-in-ten (85%) Americans agree that gas prices are a big or very big problem for the economy. But these perceptions are not very strongly related to overall economic assessments. People who have a negative view of the nation’s economy overall are slightly more likely than those who take a positive view to see gas prices as a big problem (88% vs. 81%) or as a very big problem (49% vs. 35%).
However, these differences are dwarfed by the much larger gap in perceptions of other economic problems. For example, fully 82% of people who are skeptical about the state of the economy rate the job situation as a big problem, compared with just 50% among those who are more positive. Similarly, pessimists are more than twice as likely as optimists to see the stock market as a bad investment these days (49% vs. 22%).
These correlations suggest that overall economic ratings may reflect a wide range of specific economic evaluations, a finding confirmed by a multiple regression analysis that accounts for various economic perceptions simultaneously. The analysis finds that the biggest factors in the public’s assessments of the economy are the job situation and the stock market, followed by personal financial situations. The job situation can vary widely depending on the community. When perceptions of local job conditions are included in the analysis, both the national and local job conditions are significant predictors of economic evaluations.
Most See Job Scarcity
Views of the job situation nationally are strongly related to perceptions of the local job market, and those perceptions are again headed in a negative direction after recovering somewhat during 2004. Currently, 60% of those polled say that job opportunities where they live are difficult to find; 30% say there are plenty of jobs available.
Concern about the local job situation reached a recent peak in October 2003, when 66% said jobs were hard to find, but then declined to 52% by September 2004 before rising again. For context, the current situation is still considerably better than was seen in January 1992, when 79% said jobs were hard to find and only 12% said they were plentiful.
People with low household incomes (under $20,000 annually) are far more likely than those with higher incomes to say that jobs are difficult to find in their own communities. During the 1992 recession, by contrast, all income groups said that jobs were hard to find.
In 2001, with the economy just beginning to cool off from its strong performance in the late 1990s, job concerns also showed much greater differentiation by income (a 30-point gap in perceptions between low and high income groups, with just 27% of the highest group seeing job problems, compared with 57% among the lowest income group). While overall concern about the availability of jobs has risen substantially since 2001, the gap in perceptions by income group has persisted.

As is typical, the highest level of concern about local job conditions is seen among rural residents, 74% of whom say jobs are difficult to find.
However that concern is up sharply from 61% in August 2004. Least concerned are suburban residents (at 53%).
Some other differences in perceptions of the local job market are related to income, but others are not. Blacks are more apt to see local jobs as hard to find (71% compared with whites at 57%). Democrats and independents are considerably more negative about the job scene than are Republicans. Women are more negative than men.
At the national level, the job situation is seen as a very big problem by African-Americans (38%), people earning under $20,000 (36%), and by Democrats (34%).
Other Worries
Gas prices topped the list of economic problems for most demographic groups, but were of greatest concern to middle- and lower-income people, and Democrats.
Only among those age 65 and older did any other problem rise to the level of gas prices (37% for gas prices, 35% for the federal deficit).
More than twice as many Democrats as Republicans (40% vs. 18%) mentioned the federal budget deficit as a very big problem for the economy, and independents were nearly as concerned as Democrats (34%).
Older people were more concerned than younger people. The trade deficit fourth overall with 19% citing it as a very big problem was not of particular concern to any group.
Perceptions of the affordability of housing have also become more negative, perhaps not surprising given the rapid increase in housing prices in certain areas.
Four years ago, in June 2001, 57% of those polled said housing in their community was at least “fairly affordable.” Now, just under half (49%) say this.
Changes in opinion about the affordability of housing are concentrated geographically, with fewer among those living in the Western and Northeastern regions of the nation saying housing is affordable; there has been little or no change in the perceived affordability of housing in the Midwest and South.
Views of Personal Finances
As in the past, financial issues dominate people’s personal concerns. Asked what is the biggest problem facing them and their families, roughly one-in-five (21%) volunteer that they have trouble paying bills or making ends meet; another 8% mention the overall economy; and 6% cite unemployment or low-paying jobs.
For the most part, these concerns have changed little in recent years.
But there has been notable increase in the number of Americans who cite health care or the high cost of health insurance as the biggest problem facing them and their families, from 4% in February 2003 to 10% currently. That is the highest number volunteering health care as their top personal concern since December 1993.
Americans’ views of their personal finances have declined somewhat over the past year. Currently, 44% of Americans rate their own personal financial situation as good or excellent; last August, and again in January, narrow majorities (51%) had positive opinions of their personal financial situations.
Only about one-in-five of those with household incomes of below $20,000 (17%) say their personal finances are good or excellent; by contrast, nearly two thirds of those with annual incomes of above $50,000 (65%) rate their finances positively. There also is a large racial disparity in personal economic evaluations; nearly half of whites (48%) rate their economic situation as good or excellent, compared with 22% of African-Americans.
Despite these lackluster assessments of their personal finances, most Americans (61%) continue to say that their situation will improve at least somewhat over the next year. This is comparable to the percentage expressing personal financial optimism in January (64%), though down a bit from last August (70%). Currently, just 20% feel their personal finances will get a little worse (15%) or a lot worse (5%) over the next year.
Even among groups offering bleak assessments of their personal finances low-income Americans and blacks there is a considerable degree of optimism. A majority of those with household incomes of below $30,000 (55%) expect their financial situation to improve at least some; and fully two-thirds of African-Americans (66%) are upbeat about their future financial prospects.
Little Change in Personal Concerns
Americans’ specific financial concerns have remained generally stable in recent years, despite lower assessments of their personal finances. However, there has been a notable decline in the concerns of those ages 65 and older, particularly when it comes to affording health care.
Overall, 49% of the public expresses a high level of concern over being unable to afford needed health care for their families. That is down somewhat from January 2004 (53%), with nearly all of the drop-off coming among people ages 65 and older. In January 2004, about half of senior citizens (54%) said they were very concerned about affording health care; that has declined to 36% in the current survey. Concern among other age groups has remained stable over the last year and a half.
Aside from health care, affording retirement (47% very concerned) and college costs (46%) weigh heavily on Americans. Fewer say they are very concerned about going too deeply into debt (39%), or losing a job or taking a cut in pay (30%).
Earn Enough?
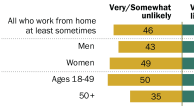
Most working Americans (59%) say they do not earn enough to lead the kind of life they want, while 40% say they do. That represents a shift from last year; in February and May, slight majorities said they earned enough to lead the kind of life they want. The current measure is more in line with results dating to the early 1990s.
Last year, the overall rise in satisfaction with earnings was driven by greater politicization of attitudes on this issue. In May 2004, 68% of Republicans who worked full- or part-time said they earned enough, compared with just 46% of Democrats. That was by far the largest partisan gap in satisfaction with earnings since the question was first asked in 1992.
This year, satisfaction with earnings has declined among members of both parties, though sizable partisan differences persist. Roughly half of working Republicans (52%) express satisfaction with earnings, down from 68% last year. Just 30% of Democrats say they earn enough to lead the life they want, compared with 46% in May 2004.
Personal Financial Situation
Despite continued growth in the economy, the number of people reporting that they were unable to buy necessities for their families at times during the last year remained at about the same levels as in the last few years and somewhat higher than in the late 1990s. Medical and health care costs are the biggest sources of financial strain, with nearly three-in-ten (29%) Americans saying that such expenses outran their pocketbooks, compared with 25% who so reported in June 2003. About one-in-five people also report insufficient funds to buy needed clothing (22%) and food (18%). But despite higher gasoline prices, the overall number of people reporting they were unable to cover necessary transportation costs is about the same as in June 2001.
As expected, those in the lowest income groups are most likely to have found it hard to make ends meet over the last year: Among families with less than $20,000 in yearly income, 43% lacked money for food, and nearly six-in-ten (57%) faced unaffordable medical expenses. By the same token, people who are unemployed or working part-time because they cannot find full-time jobs are far more likely to feel the pinch than those who are fully employed (working full-time or part-time by choice), retired, or not seeking work.
Nevertheless, significant numbers of middle-income and even higher-income people also report shortfalls in their ability to buy necessities for their families. More than one-in-five families (22%) with annual household incomes of between $50,000 and $75,000 felt strained by medical and health care costs over the last year, as did a third (34%) of those with income in the $30,000 to $50,000 range.
Minorities continue to endure far more financial strain than do white Americans. Black families are the most likely to have lacked necessities in the previous year, with more than a third (36%) running short on money for food, and higher percentages saying they were unable to purchase needed clothing, gas and medical care.
Not surprisingly, employment status is a major determinant of every aspect of financial stability among American families. Among the fully employed, more than a third report at least one type of deprivation. And fully 72% of those who are unemployed or underemployed (part-time workers who would prefer to be full-time) found themselves unable to afford family necessities during the last year. The self-employed and those holding two or more jobs are also more likely to report pocketbook shortfalls than are full-time workers. Fewer retirees than working Americans report running short of money for necessities.
A similar, but still more pronounced, pattern is evident in regard to health insurance. While just 12% of the fully employed lack such coverage, nearly three times as many (34%) of the unemployed and underemployed are medically uninsured; 30% of those who are self-employed also lack health coverage. By comparison, owing in large part to Medicare, only 8% of retirees are without health insurance.
And while only 8% of the fully employed and 6% of retirees say they owe a lot more in consumer debt not including mortgage debt than they can afford, 23% of those who are unemployed or underemployed say their credit card and installment debt outruns their means by a lot, and an additional 29% report at least “a little” more consumer debt than they can handle.
This pattern of financial stress does not, however, translate directly into families’ perceptions of the major problems facing them. Despite their differing levels of purchasing power and debt, roughly 30% of the fully employed, the multiple job holders, the unemployed and the underemployed as well as the retired, all name various aspects of the economy or their personal finances as their major problem. Only the self-employed are somewhat less likely to cite the economy or personal finances as a major concern in this regard (21% do so).
The tendency to spend beyond one’s means runs across the U.S. income distribution (10% of those with annual incomes of $75,000 or more and 25% of those with income between $50,000 and $74,999 say they have at least a little more credit card and installment debt than they can afford). But, unsurprisingly, debt burdens are highest in the lower income ranges. Among those with less than $20,000 in yearly income, 19% have a lot more debt than they can shoulder, while another 19% say they have a little more.
However substantial, the levels of consumer indebtedness are essentially unchanged from their levels in June 2001. And even at the lowest income levels, debt is not all pervasive; 16% of people with incomes of less than $20,000 report having no debt, the highest percentage of any income group.
Overall, 10% of Americans say they have at some time been forced to declare personal bankruptcy. While the frequency of bankruptcy is highest among those with the lowest incomes, the distribution by income is not as sharply skewed as in the case of debt. About 8% of those with annual incomes of $75,000 or more report having filed for bankruptcy protection against creditors, compared with 12% in the middle-income ranges and 14% of those with less than $20,000 a year. Salaried workers are less likely than hourly workers to declare bankruptcy (7% vs.12%). However, among employment groups, the self-employed are the most likely to exhaust their resources, with 17% reporting a bankruptcy declaration at some time in the past.

On the positive side of the balance sheet, over half (56%) of Americans report having some stock market investments, about the same proportion as in an October 2002 Pew survey. A plurality (46%) holds stocks as part of a 401(k) or other retirement plan, but 37% own shares in mutual funds outside of a retirement plan and about a quarter (23%) hold individual stocks.
Relatively few Americans, however, are active stock traders; 22% bought or sold stocks at any time over the past year; only 12% traded within the last six months.
Stock holdings remain most prevalent among higher income families 84% of those with incomes above $75,000 and 72% of those with income between $50,000 and $75,000 are market investors in one form or another. Higher income investors are also most likely to be active traders.