
The
NEXT
America
Two Dramas In Slow Motion
Demographic transformations are dramas in slow motion. America is in the midst of two right now. Our population is becoming majority non-white at the same time a record share is going gray. Each of these shifts would by itself be the defining demographic story of its era. The fact that both are unfolding simultaneously has generated big generation gaps that will put stress on our politics, families, pocketbooks, entitlement programs and social cohesion.
The Pew Research Center tracks these transformations with public opinion surveys and demographic and economic analyses. Our new book, The Next America, draws on this research to paint a data-rich portrait of the many ways our nation is changing and the challenges we face in the decades ahead.
Let’s start with what demographers call an “age pyramid.” Each bar represents a five year age cohort; with those ages 0-4 on the bottom and those ages 85 and older on the top. In every society since the start of history, whenever you broke down any population this way, you’d always get a pyramid.
But from 1960 to 2060, our pyramid will turn into a rectangle. We’ll have almost as many Americans over age 85 as under age 5. This is the result of longer life spans and lower birthrates. It’s uncharted territory, not just for us, but for all of humanity. And while it’s certainly good news over the long haul for the sustainability of the earth’s resources, it will create political and economic stress in the shorter term, as smaller cohorts of working age adults will be hard-pressed to finance the retirements of larger cohorts of older ones.
The New Us
America’s Racial Tapestry Is Changing
At the same time our population is going gray, we’re also becoming multi-colored. In 1960, the population of the United States was 85% white; by 2060, it will be only 43% white. We were once a black and white country. Now, we’re a rainbow.
| Year | All Other | Asian | Hispanic | Black | White |
|---|---|---|---|---|---|
| 1960 | 0 | 1 | 4 | 10 | 85 |
| 1970 | 0 | 1 | 5 | 11 | 83 |
| 1980 | 1 | 2 | 6 | 12 | 80 |
| 1990 | 1 | 3 | 9 | 12 | 76 |
| 2000 | 2 | 4 | 13 | 12 | 69 |
| 2010 | 3 | 5 | 16 | 12 | 64 |
| 2020 | 3 | 6 | 19 | 13 | 60 |
| 2030 | 4 | 6 | 22 | 13 | 55 |
| 2040 | 4 | 7 | 25 | 13 | 51 |
| 2050 | 5 | 8 | 28 | 13 | 47 |
| 2060 | 6 | 8 | 31 | 13 | 43 |
Our intricate new racial tapestry is being woven by the more than 40 million immigrants who have arrived since 1965, about half of them Hispanics and nearly three-in-ten Asians.
Because these tranformations happen tick by tock, without anyone announcing them with a drum roll or press conference, they are sometimes hard to perceive.
But every so often societies experience “aha” moments, when the change is right there in plain sight. We had several such moments in early 2014, as three iconic American brands, Coke, Chevy and Cheerios, rolled out ads during the Super Bowl and Olympics that were aimed at what one voice-over called “the new us.”
Product advertisers aren’t in the business of making political statements. They’re certainly not in the business of making enemies. They must have known some of their images – interracial families, same-sex parents, “America the Beautiful” sung in several languages – would disturb some of their customers. But they also do their market research and look at their numbers. They know how fast the country is changing.


“Intermarriage is playing a big role in changing some of our views of ethnicity”
Mark Lopez – Director of Hispanic Research
Immigration Is Driving Our Demographic Makeover
Our modern immigrants are different from the big waves of newcomers who came in the late 19th and early 20th centuries. Back then, about nine-in-ten immigrants were from Europe. Today only about 12% are from Europe.
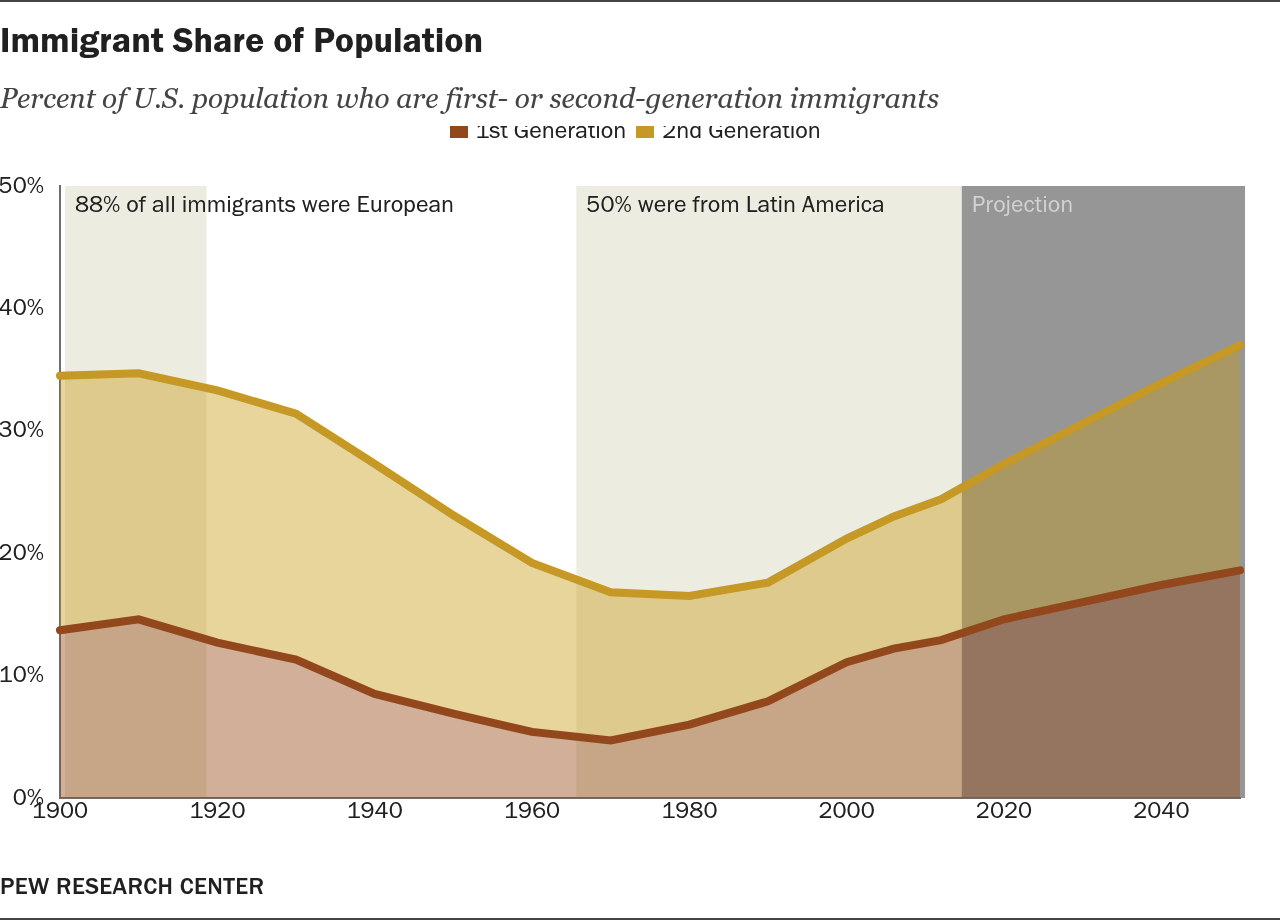
| Year | 1st Generation | 2nd Generation | Total |
|---|---|---|---|
| 1900 | 13.7 | 20.8 | 34.5 |
| 1910 | 14.6 | 20.1 | 34.7 |
| 1920 | 12.7 | 20.6 | 33.3 |
| 1930 | 11.3 | 20.1 | 31.4 |
| 1940 | 8.5 | 18.8 | 27.3 |
| 1950 | 6.9 | 16.2 | 23.1 |
| 1960 | 5.4 | 13.8 | 19.2 |
| 1970 | 4.7 | 12.1 | 16.8 |
| 1980 | 6.0 | 10.5 | 16.5 |
| 1990 | 7.9 | 9.7 | 17.6 |
| 2000 | 11.1 | 10.1 | 21.2 |
| 2006 | 12.2 | 10.8 | 23.0 |
| 2012 | 12.9 | 11.5 | 24.5 |
| 2020 | 14.6 | 12.7 | 27.3 |
| 2030 | 16.0 | 14.6 | 30.6 |
| 2040 | 17.4 | 16.5 | 33.9 |
| 2050 | 18.6 | 18.4 | 36.9 |
But some things don’t change. No matter where they come from, immigrants are strivers. They’re optimists. And they tend to have a lot of kids. Our immigrant stock – that’s immigrants and their children – is projected to make up about 37% of our population by mid-century, the highest share in our history.
But understand: this isn’t new. We’ve always been a nation of settlers and immigrants. In this regard, the middle of the 20th century wasn’t the norm, it was the outlier.
Intermarriage Blurs Labels
Here’s an interesting question: By 2050, will our racial categories still make much sense? These days our old labels are having trouble keeping up with our new weddings. A half century ago racial intermarriage was illegal in a third of the states and a gasp-inducing taboo just about everywhere else. Today, nearly one-in-six newlyweds marry across racial or ethnic lines.
| Year | Newly Married |
|---|---|
| 1960 | 2.4 |
| 1965 | 2.9 |
| 1970 | 4 |
| 1975 | 5 |
| 1980 | 6.7 |
| 1985 | 7.3 |
| 1990 | 8.3 |
| 1995 | 9.3 |
| 2000 | 11.2 |
| 2005 | 13.1 |
| 2008 | 14.5 |
| 2009 | 15.4 |
| 2010 | 15.1 |
| 2011 | 15.5 |
Changing Perception of ‘Mixed Race’
More than a quarter of Hispanic and Asian newlyweds “marry out,” as do one-in-six blacks and one-in-ten whites. Whites are still the largest race group, so even though they “marry out” at lower rates, they still account for 70% of all interracial marriages.
| Independent variable | Black | Mixed Race |
|---|---|---|
| All | 27 | 52 |
| White | 24 | 53 |
| Black | 55 | 34 |
| Hispanic | 23 | 61 |
By mid-century, what will we call the children of interracial marriages? Today we aren’t even sure what to call our president. We do know this: In many cultures and societies through history, being mixed race – being a “mutt” as Obama sometimes calls himself – has meant being an outcast. In today’s America, judging by those Super Bowl ads or today’s celebrities, the norms are changing and the stigma receding.
Today’s Celebrities Reflect America’s Demographic Shifts
You probably know the names of these celebrities. Do you know their racial and ethnic ancestry?

Derek Jeter
Father:
African American
Mother:
Irish, German

Cameron Diaz
Father:
Spanish-Cuban
Mother:
English, Scots-Irish, German
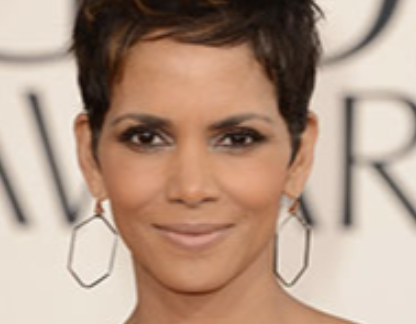
Halle Berry
Father:
African American
Mother:
English, German

Bruno Mars
Father:
Puerto Rican
Mother:
Filipina

Apolo Ohno
Father:
Japanese
Mother:
European

Norah Jones
Father:
Indian
Mother:
American

Selena Gomez
Father:
Mexican
Mother:
Italian-American

Tiger Woods
Father:
African American
Mother:
Thai, Chinese, Dutch
The Generational Divide
Portraits of America
Generations tend to be about 20 years in length and are shaped by the historical events people experience at roughly the same stage in their life cycle. As a result, they share what might loosely be called a generational persona, one that’s also influenced by (and often in reaction to) the persona of their parents’ generation.
Gen X: Ages 34 – 49

Xers: Born 1965-1980
- Children of the Reagan revolution and the divorce revolution, they’re distrustful of institutions, especially government.
- On economic issues and the role of government, they tilt conservative. But they’re social liberals.
- More comfortable than their elders with America’s growing racial diversity.
Boomer: Ages 50 – 68

Boomers: Born 1946-1964
- Born during the big spike in fertility that began after World War II and continued until the birth control pill came to market.
- Famous for leading the counterculture protests of the 1960s, but about half or more have grown more conservative as they’ve aged.
- 10,000 Boomers are turning 65 every single day between now and 2030.
Silents: Ages 69 – 86

Silents: Born 1928-1945
- The most financially secure generation.
- The most uneasy with the pace of demographic, cultural, social, racial and technological change.
- About eight-in-ten are white, making them a faithful portrait of America circa 1960.
- The generation least supportive of an activist government. But hands off their Social Security and Medicare.
While obviously there are as many different personality types within a generation as across generations, there’s value in understanding what defines a generation. Pew Research surveys have allowed for comparisons between today’s young and today’s old. Because we’ve been asking the same questions over many years, we can also compare today’s young with yesterday’s young. Let’s start with the thumbnail sketches.
Who Are the Millennials?
The Millennials are our youngest adult generation. They’re America’s most racially and ethnically diverse generation ever. More than four-in-ten are non-white, many the U.S.-born children of the big wave of Hispanic and Asian immigrants who began arriving half a century ago.
Related: Millennials in Adulthood
Millenial: Ages 18 – 33

Millennials: Born after 1981
- They’re less religiously affiliated, and they’ve been slow to marry and have children.
- “Digital natives” who grew up with cellphones and social networking. Highly educated, but because of the economy, struggling financially.
- On politics, half identify as independents, more than any generation.
They’re political and social liberals, they’re social media wizards, they’re highly educated, they’re not very religious, they’re slow to marry and have kids, and many are saddled with college debt and lousy jobs. Because of their difficulties getting launched in a tough economy, 46% have at some point boomeranged back to their childhood homes, where the refrigerator is stocked, the washing machine isn’t coin-operated, and all their dreams are on hold, but intact. Despite these economic woes, Millennials are the nation’s most dogged optimists. They believe their own best days are ahead – and so are America’s.

“10,000 Baby Boomers a day will turn 65 – every single day between now and the year 2030”
Paul Taylor – Author, The Next America
The Age, Race Voting Gaps
In the past few elections, the young/old partisan voting gap has been the biggest since the voting age was lowered to 18 in 1972. As recently as the year 2000, there had been no difference in the way young and old in America voted. Now, there’s a chasm.
Percent who voted for Barack Obama or Mitt Romney in the 2012 presidential election
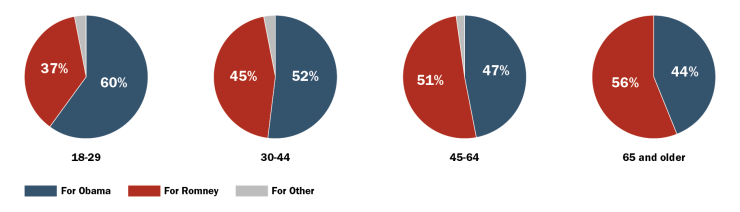
Percent who voted for Barack Obama or Mitt Romney in the 2012 presidential election

Six-in-ten young voters supported Barack Obama in his re-election bid in 2012, compared with just 47% of those in the age ranges of their parents (45 to 64) and 44% of their grandparents (65 and older). By race, six-in-ten white voters supported Republican candidate Mitt Romney, whereas more than nine-in-ten black voters supported Obama. Obama also captured more than 70% of the Asian-American and Hispanic vote.
Liberal Youth, Conservative Elders
Millennials have voted more Democratic than older voters in the past five national elections. They came of age in the Bush and Obama eras and hold liberal attitudes on most social and governmental issues, as well as America’s approach to foreign policy.
| Year | Silent | Boomer | Gen X | Millenial |
|---|---|---|---|---|
| 1990 | 14 | 17 | 21 | null |
| 1991 | 12 | 21 | 20 | null |
| 1993 | 19 | 27 | 26 | null |
| 1994 | 19 | 24 | 28 | null |
| 1996 | 21 | 27 | 31 | null |
| 1998 | 17 | 31 | 32 | null |
| 2000 | 24 | 30 | 41 | null |
| 2002 | 17 | 34 | 40 | null |
| 2004 | 22 | 36 | 42 | 34 |
| 2006 | 27 | 34 | 34 | 36 |
| 2008 | 23 | 39 | 38 | 58 |
| 2010 | 24 | 41 | 41 | 55 |
| 2011 | 31 | 41 | 49 | 65 |
| 2013 | 32 | 50 | 54 | 69 |
| 2014 | 30 | 52 | 53 |
| Year | Silent | Boomer | Gen X | Millenial |
|---|---|---|---|---|
| 2001 | 21 | 32 | 49 | null |
| 2003 | 17 | 33 | 40 | null |
| 2004 | 18 | 30 | 40 | 44 |
| 2005 | 23 | 36 | 44 | 49 |
| 2006 | 20 | 34 | 42 | 51 |
| 2007 | 24 | 34 | 42 | 53 |
| 2008 | 24 | 36 | 44 | 54 |
| 2009 | 23 | 32 | 41 | 51 |
| 2010 | 29 | 38 | 48 | 53 |
| 2011 | 32 | 40 | 48 | 61 |
| 2012 | 33 | 41 | 51 | 64 |
| 2013 | 35 | 41 | 52 | 66 |
| 2014 | 38 | 48 | 55 | 68 |

“Voter turnout among Millennials has been remarkably solid.”
Michael Dimock – Vice President, Research
Just as members of the Silent Generation are long-term backers of smaller government, Millennials, at least so far, are strong supporters of a more activist government.
On some social issues, such as legalizing marijuana and same-sex marriage, Millennials particularly stand out for their favorable views compared with other generations. Nearly seven-in-ten (68%) Millennials favor allowing gays and lesbians to marry, compared with just 48% of Baby Boomers and just 38% of the Silent Generation.
The Young Are Less Religiously Affiliated
The generations are divided by more than race and politics. The young are the least religiously affiliated group in modern American history; the old are the most devout believers in the advanced, industrialized world.
Religious Affiliation by Generation
Percent saying they are affiliated with a religion or are unaffiliated
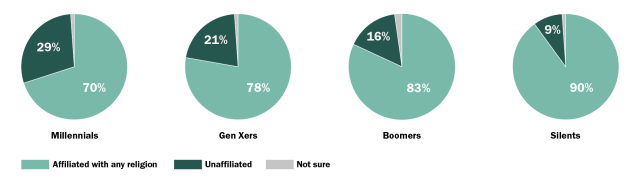
Source: Aggregated data from Pew Research Center for the People and the Press surveys, Jan.-Feb. 2014
A record one-in-five American adults today – and fully three-in-ten Millennials – do not have any religious affiliation. Of these so-called “nones,” roughly three-in-ten describe themselves as atheists or agnostics; the remainder say they have no particular religion.
The Technology Gap
Then there’s the technology revolution. Today’s young are history’s first generation of digital natives. The online world isn’t something they’ve had to adapt to — it’s all they’ve ever known, and it’s their indispensable platform for social interactions and information acquisition.
| Date | All Internet Users | 18 – 29 | 30 – 49 | 50 – 64 | 65+ |
|---|---|---|---|---|---|
| 02/2005 | 8 | 9 | 7 | 6 | null |
| 08/2006 | 16 | 49 | 8 | 4 | 1 |
| 05/2008 | 29 | 67 | 25 | 11 | 7 |
| 04/2009 | 46 | 76 | 48 | 24 | 13 |
| 05/2010 | 61 | 86 | 61 | 47 | 26 |
| 08/2011 | 64 | 87 | 68 | 49 | 29 |
| 02/2012 | 66 | 86 | 72 | 50 | 34 |
| 08/2012 | 69 | 92 | 73 | 57 | 38 |
| 12/2012 | 67 | 83 | 77 | 52 | 32 |
| 05/2013 | 72 | 89 | 78 | 60 | 43 |
| 09/2013 | 73 | 90 | 78 | 65 | 46 |
Today’s old have been playing catch-up online, some more enthusiastically than others, but they have a long way to go. The typical Millennial who uses social media has 250 Facebook friends — making them five times “friendlier” than the smaller number of Silents who use social media.
The Showdown
We Have a Big Challenge Ahead
At a time when young and old don’t look alike, think alike or vote alike, how will America modernize its entitlement programs so they’re in sync with its new demographics? How can we keep faith with the old without bankrupting the young and starving the future? It will be difficult.
Support for Retirement
We start with this reality: Social Security and Medicare are practically sacrosanct. Nearly nine-in-ten Americans say they’re good for the country. That’s an amazing number. But the popularity of these programs really isn’t all that surprising. People love them because they do what they were created to do. They ease many of the frets and dreads of old age – a blessing not just for seniors but for everyone who loves, supports and depends on seniors. Which is to say, everyone.
| Independent variable | Social Security | Medicare |
|---|---|---|
| Millenials | 81 | 87 |
| Gen Xers | 88 | 89 |
| Boomers | 88 | 85 |
| Silents | 91 | 92 |
Saving the Safety Net
Changing Worker-Beneficiary Ratio
The first monthly Social Security benefit check was issued in 1940. By 1945 there were 42 workers for every beneficiary. In 1950, sixteen-to-one. In 2010 there were only three workers for each person in retirement.
But the status quo is unsustainable. Some 10,000 Baby Boomers will be going on Social Security and Medicare every single day between now and 2030. By the time everyone in this big pig-in-the-python generation is drawing benefits, we’ll have just two workers per beneficiary – down from three-to-one now, five-to-one in 1960 and more than forty-to-one in 1945, shortly after Social Security first started supporting beneficiaries.
The math of the 20th century simply won’t work in the 21st. Today’s young are paying taxes to support a level of benefits for today’s old that they have no realistic chance of receiving when they become old. And they know it – just 6% of Millennials say they expect to receive full benefits from Social Security when they retire. Fully half believe they’ll get nothing.

“I think the Boomers are feeling in better shape than the generation that’s right behind them.”
Kim Parker, Director of Social Trends Research
Over the Horizon
Meantime, the cost of our programs for seniors will soon exceed half of the federal budget. This spending continues to crowd out budgeting for education, research and infrastructure – investments that would help build a better future for Millennials and their children.
At its core, this is a problem of generational equity. But it need not lead to a generation war. A war needs combatants. We find very little evidence from our Pew Research surveys that old and young are spoiling for a fight over these issues. To the contrary, they like each other too much. And nowadays more than 50 million, a record, are living in multi-generational family households, their fortunes braided together, because that turns out to be a good way to make ends meet in hard times.
If Americans can bring to the public square the same genius for generational interdependence they bring to their family lives, the politics of these issues will become less toxic and the policy choices less forbidding.
That’s a big ‘if.’ But it’s a start.