
In arguing for the ratification of the U.S. Constitution, James Madison wrote in the Federalist Papers that “the most common and durable source of factions has been the various and unequal distribution of property.” Because the study of public opinion is often the study of the political factions in society, polls need to be able to measure the economic circumstances of individuals who directly experience “the various and unequal distribution of property.”
No single measure of a person’s economic situation is wholly adequate for this purpose. We can – and do – ask if respondents own the home they live in, and occasionally we ask if they have money in investments like stocks or mutual funds. But asking deeper questions about property and wealth takes time, and many find such questions intrusive. Instead, personal, family or household annual income is often used as a shorthand – if imperfect – indicator of Americans’ financial circumstances.
“…asking deeper questions about property and wealth takes time, and many find such questions intrusive. Instead, personal, family or household annual income is often used as a shorthand – if imperfect – indicator of Americans’ financial circumstances.”
For government officials, income is a vital measurement to determine program eligibility and allocate funding for affordable housing, Medicaid, education and more. At Pew Research Center, we use income to understand how Americans’ attitudes and experiences differ depending on their financial status. But despite its importance, income is notoriously difficult to measure accurately.
The challenges of measuring income
A cardinal rule of writing survey questions is that respondents need to be willing and able to answer them. Income questions are often associated with high rates of item nonresponse – that is, when respondents decline to answer certain questions. Some respondents may be reluctant to answer income-related questions because they consider them uncomfortable or an invasion of privacy.
On Pew Research Center surveys, questions on income are refused more often than any other demographic question. Typically, item nonresponse for questions on gender, race and education hovers around 1% or less. But on an American Trends Panel survey conducted in 2023, 5% of respondents refused to answer the family income question.
Notably, a 5% refusal rate is relatively low compared with past surveys. Prior to the establishment of the online panel, refusals to the income question averaged about 13% in our telephone surveys. Several government surveys have even higher rates of nonresponse on income questions, in some cases ranging from 20% to 40%.

Historically, higher-income respondents have been especially hesitant to disclose their income and assets. Their aversion can be seen as early as the 1940 census, when the U.S. Census Bureau first began asking income-related questions. In response to concerns from high-earning Americans, Census interviewers grouped any incomes above $5,000 together as $5,000+. The interviewer instructions noted, “Some persons who might otherwise be reluctant to report wages or salary would be quite willing to do so if they learn that the amount above $5,000 need not be specified.”
Respondents might also skip or struggle to answer income-related questions because they do not know their family income, or they don’t feel they can answer with the specificity that the question seems to ask for.
Because income can come from multiple sources, like a full-time job, a part-time job, tips, gig work, public assistance or stocks, it might be difficult for respondents to remember each and every income source and add them all together accurately. This might be especially complicated for respondents who do not have a regular work schedule or who have fluctuating wages. In addition, when respondents are asked about their total family income, they may not know the earnings of each member of their family.
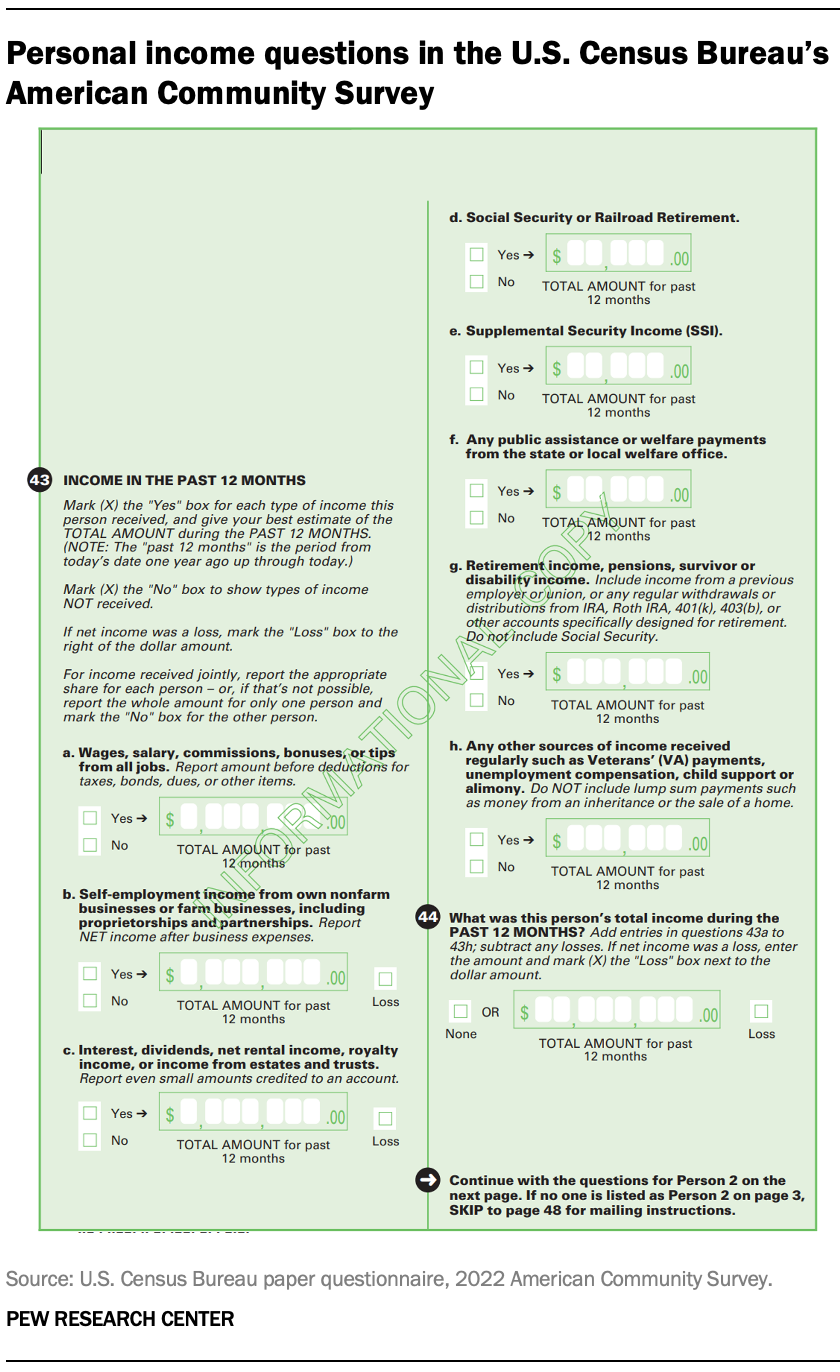
The U.S. Census Bureau tries to improve the accuracy of their income measurement by using multiple questions about different possible sources of income for each person in a household. But this approach doesn’t fully overcome the limitations of what the respondent may actually know or be willing to share. Asking a range of detailed income questions is not always realistic for survey researchers, either. Government surveys like the Current Population Survey or the annual American Community Survey use a detailed series of questions because their statistics are relied upon as the definitive national measurement of income. Most social science researchers are limited to shorter surveys and often do not have the space to mimic the Census Bureau’s approach, even if respondents are willing to answer such detailed questions.
How we measure income
Center surveys generally ask about total family income, rather than individual or household income, as part of our standard group of demographic questions.
The goal of asking about family income rather than individual income is to gain a more complete picture of the total income-related resources that a respondent might rely upon. This is especially important for respondents who are not the sole earner of their household.
While family income is similar to household income, they differ in important ways. The U.S. Census Bureau defines household income as the total income of all people ages 15 and older who live in the household, including people who may not be related to the respondent (such as roommates). On the other hand, family income is meant to include the income from just the people within a household that are related to or cohabitating with the respondent.
Surveys like the General Social Survey and the American National Election Studies have been asking about family income for decades. But other than those conducted by the government or for official purposes, most surveys (including ours) do not spell out the various age and household composition qualifications in detail, nor do they include the level of detail necessary to capture a respondent’s exact income figure. To do so would require significant time and space, and runs the risk of frustrating respondents. The consequence of forgoing this added detail is that income estimates are less precise than many other demographic characteristics captured in surveys.
Addressing sources of error in income questions
Researchers can combat nonresponse and measurement error on income questions in a few ways.
The first is by asking about income using categories or brackets rather than asking respondents to provide an exact number. For respondents who feel uncomfortable disclosing their exact income, the income brackets can provide a sense of anonymity.
Providing income brackets can also make answering easier for respondents who might not have an exact picture of their income but have a rough idea of where they fall. And if a respondent does not recall all of the various income sources they have, their actual total income may still fall in their selected bracket.
While income ranges do not provide the same detail as a write-in figure, respondents are generally more willing to answer with a range than with an open-end question. In this case, the benefits are likely to outweigh the costs.
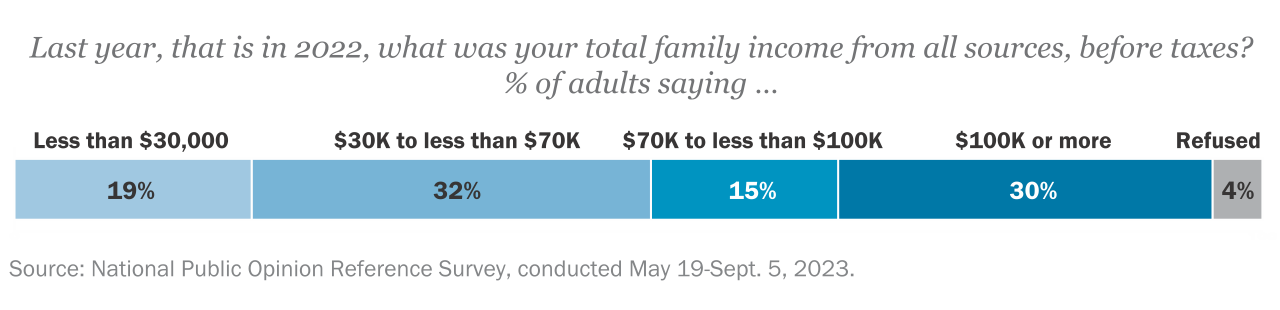
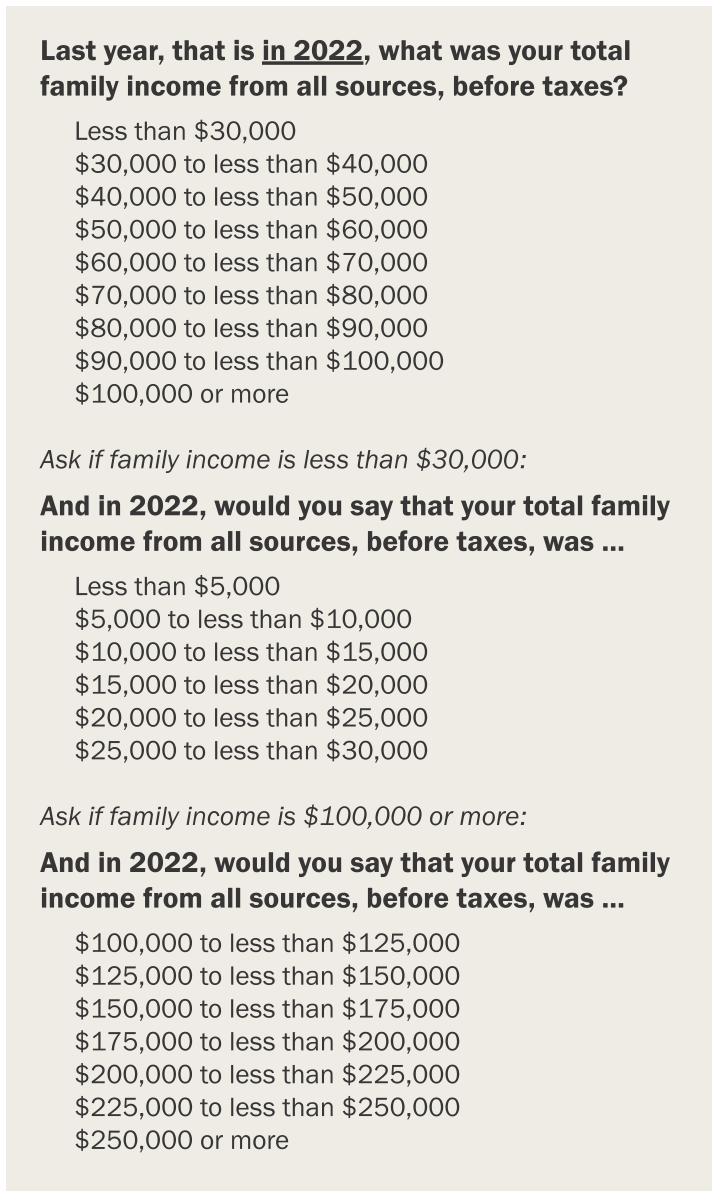
On the Center’s American Trends Panel, researchers typically ask about income in a sequence of questions. The first asks respondents to select their income from a list of brackets, with options for “less than $30,000,” “more than $100,000” and a set of categories between these two. If a respondent indicates their family income is below $30,000 or above $100,000, they will receive one of two follow up questions asking them to specify further.
This process can lower item nonresponse rates among those with the highest and lowest family incomes. For instance, a respondent with a family income of $260,000 might feel comfortable saying their earnings are above $100,000 but would not feel comfortable specifying further. In these cases, Center researchers can still collect limited information on income from respondents who might have otherwise refused the question altogether.
Finally, income questions often reference the previous calendar year rather than “the past 12 months” because income taxes for individuals are typically computed on a calendar year basis. People may be more likely to recall the income reported on a tax form from a previous year. Recalling the past 12 months’ income may require a mental calculation that people cannot or will not undertake.
Going beyond income brackets to income tiers
While family income can be a useful tool to understand Americans’ finances, annual income alone can present a misleading picture of a respondent’s financial situation. Families differ in size and the cost of living varies depending on where people live.
For instance, consider two respondents who each say they have a family income of $70,000. One lives alone in Jackson, Mississippi, and the other lives with their spouse and four children in San Francisco, California. Using the standard income brackets, these respondents would be grouped and analyzed in the same category. But the lived experiences of these two people might be very different, given the needs of each household and the cost-of-living differences between the two locations. Lumping these two households into the same category might not be effective when researchers want to analyze how respondents in different socioeconomic groups interact with their communities and the world around them.
To address these concerns, Pew Research Center researchers created a three-category measure of purchasing power called income tiers. These tiers consider household size and geography along with family income.
To create the income tiers, Center researchers identify each respondent’s cost-of-living adjusted family income by accounting for differences in prices across states and metropolitan areas. They also account for the respondent’s household size. Using this adjusted income, each respondent is assigned to an income tier. Respondents are classified as lower income if their adjusted family income falls below two-thirds of the median adjusted income of all the survey respondents; middle income if their income is two-thirds to double the median; and upper income if it’s greater than double the median.
On the American Trends Panel, researchers reassess each panelist’s income tier on an annual basis, using updated income information from the latest calendar year. The median income in this case comes from the entire panel, and not from the subset of panelists in each individual survey.
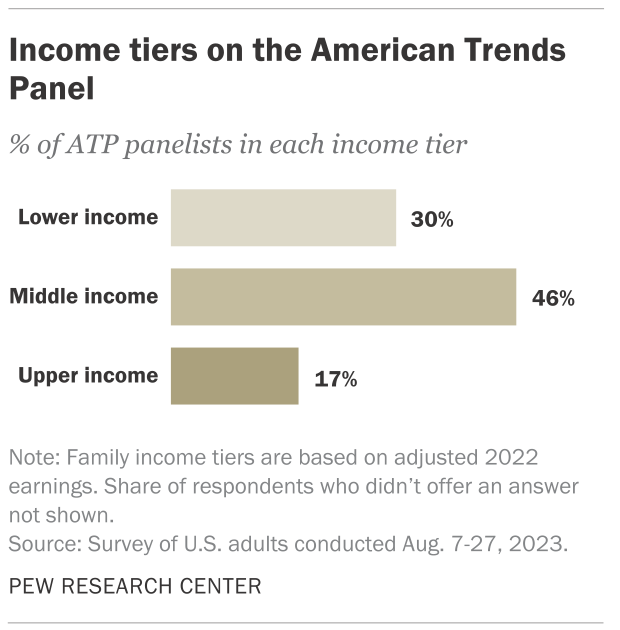
Using this method, 30% of panelists are lower income, 46% are middle income and 17% are upper income. An additional 7% skipped either the income question or household size question, and as a result could not be assigned an income tier.
Using income tiers to understand public opinion
Income tiers often tell a clearer story of how Americans’ attitudes and experiences differ than we would see just using income. Consider our analysis of layoffs during the COVID-19 pandemic: When looking at the unadjusted data, Americans with a family income less than $30,000 appear just as likely as Americans with an income between $30,000 and $74,999 to say that they or someone in their household has been laid off or lost a job because of COVID-19.
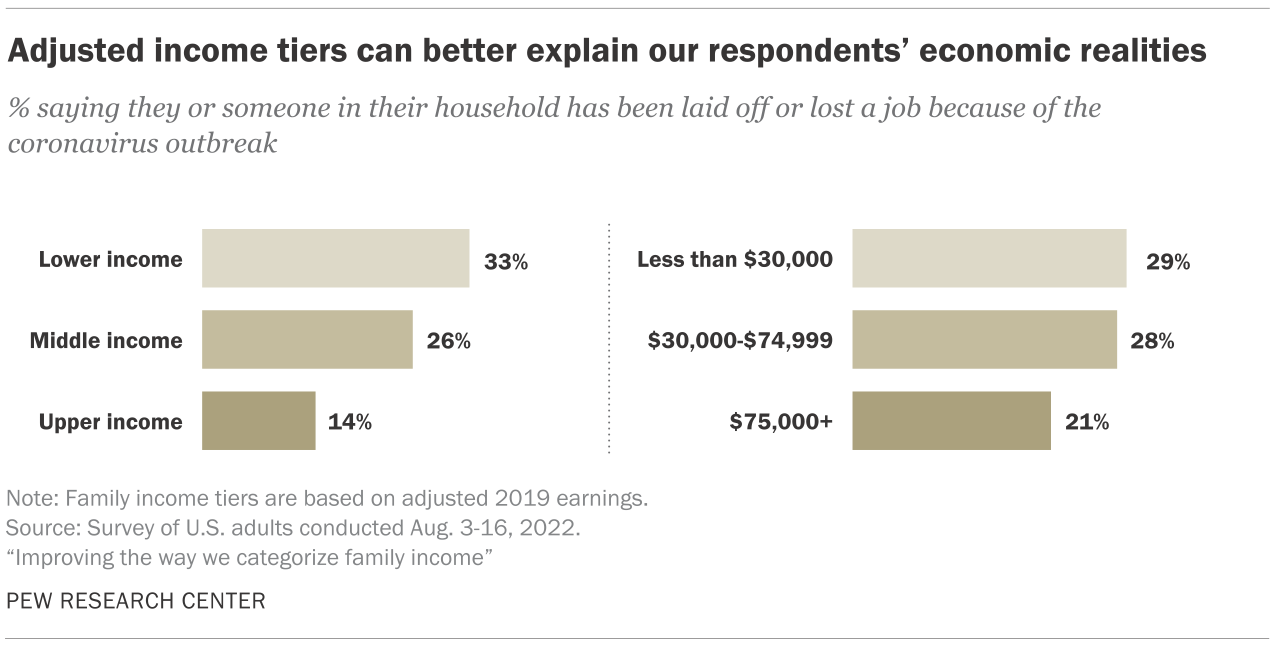
However, when accounting for household size and geographic differences, Center researchers were able to see that Americans in the lower income tier were more likely to have experienced a job loss in their household. In general, the association between financial situation and likelihood of a layoff is stronger when income tiers are used as the measure, rather than income itself.
Going forward, our researchers will continue to use income tiers as a key tool to understand Americans’ attitudes and experiences. Recent Center analysis finds that workers from lower-income families are less likely to view their career as central to their identity. Lower-income parents are also the least likely to say they are trying to raise their children similarly to how they were raised, and lower-income adults are the most likely to say that lack of affordable housing is a major problem where they live.
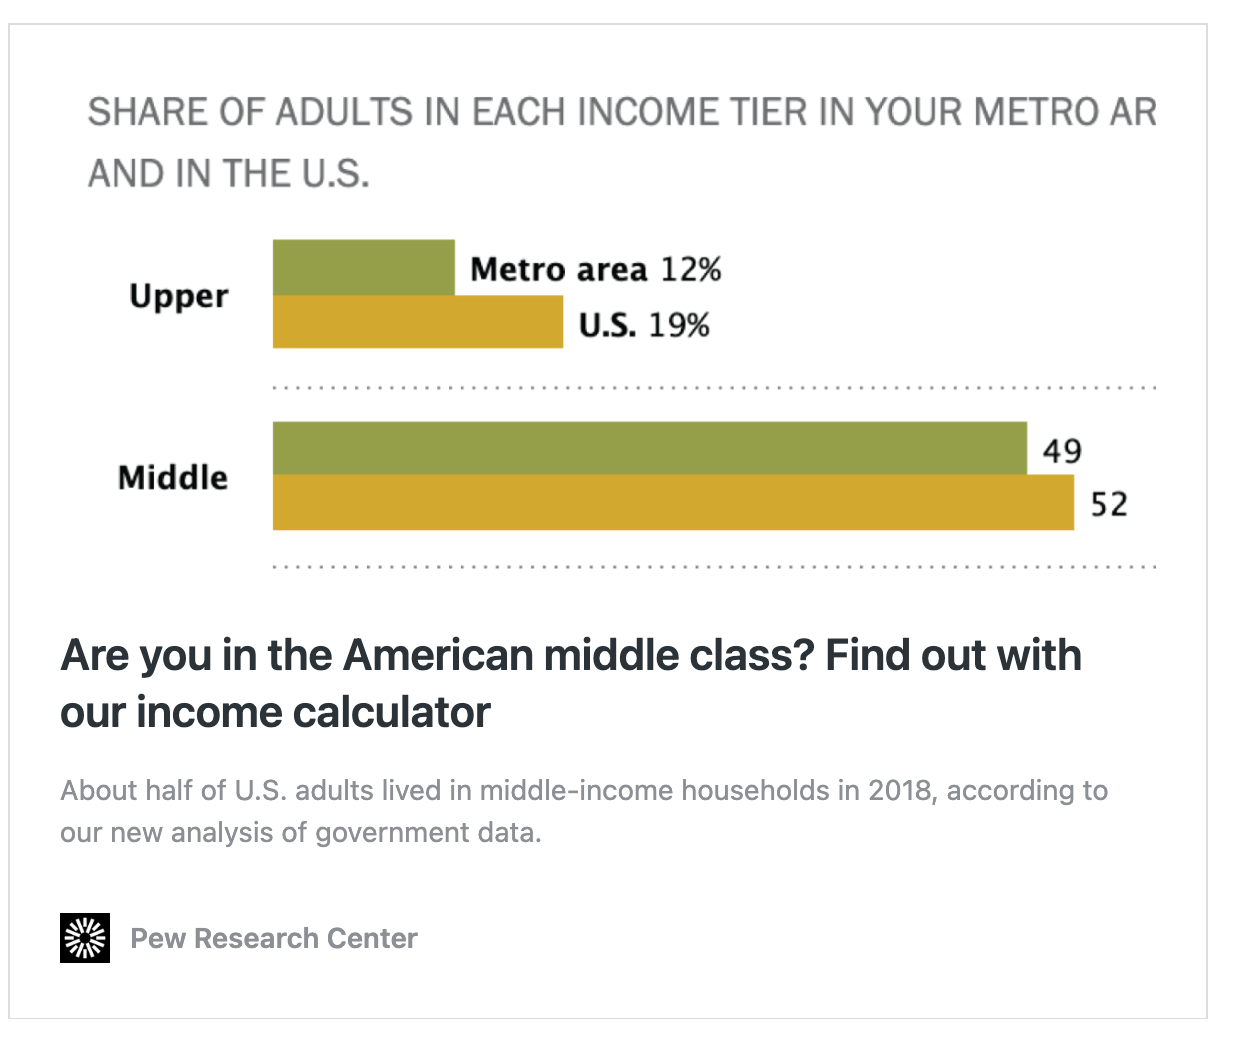
Related: Are you in the American middle class? Find out with our income calculator
