
By Kyley McGeeney and Courtney Kennedy
As telephone interviewing costs continue to rise and cellphones represent an increasing share of survey samples, survey researchers are exploring approaches to make these designs more cost-effective. A recent advancement in telephone random-digit-dial (RDD) studies1 is the ability to identify nonworking cellphone numbers using what are known as “activity flags.” Activity flags allow researchers to remove flagged nonworking cellphone numbers from the sample before they are dialed, thereby helping to contain rising interview costs.
One concern with using these flags, however, is that they might also erroneously flag eligible cellphone numbers for removal from the sample and in turn reduce the survey population coverage rate. This reduction in coverage can lead to bias in the resulting survey estimates.
Pew Research Center recently investigated the performance of these flags in the Center’s 10,000 case, dual-frame RDD survey of U.S. adults conducted in early 2014. The primary finding is that while there was a measurable reduction in the population coverage rate, the effect on final weighted estimates was small.
A large portion of cellphone RDD number are nonworking
Telephone survey researchers are very interested in using activity flags as a tool to combat rising data collection costs. One factor driving up the cost of cellphone interviewing is the substantial share of nonworking numbers in the sample dialed by interviewers. This results in wasted interviewer time. The incidence of nonworking numbers in the U.S. cellphone RDD frame was approximately 38% in 2015, based on results from Pew Research Center surveys.
Survey sample vendors began offering activity flags in 2012 as a way to increase interviewing efficiency. How the flag is created varies across vendors. Depending on the vendor, the flag reflects either past calling activity of a given number or a real-time test of the number’s status as in service or not. Pew Research Center evaluated both types of activity flag by appending them to the cellphone sample drawn for a national RDD survey. Consistent with other research,2 researchers found that the flag relying on the real-time test performed better than the flag based on past calling activity. Analysis in the report is based solely on the real-time test flag.
Activity flags lead to removal of nonworking cellphone numbers but also some working ones
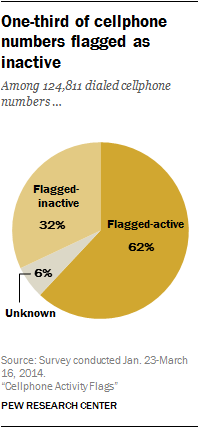
Among the 124,811 cellphone numbers dialed in the 2014 Pew Research Center survey studied here, roughly six-in-ten (62%) were flagged as active, nearly one-third (32%) were flagged as inactive and the remainder (6%) had unknown status.
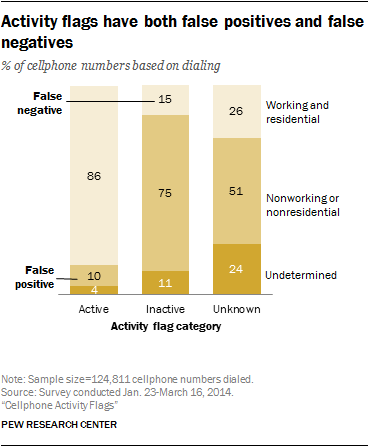
A comparison of the activity flags to the final dispositions assigned by the interviewers reveals that while the flag is accurate for the majority of cases, there are both false positives (numbers flagged as active that are actually nonworking or nonresidential) and false negatives (numbers flagged as inactive that are actually working and residential).
Among the flagged-inactive cases, 15 percent were found to be working and residential (false negatives). Among the flagged-active cases, 10 percent were found to be nonworking or nonresidential (false positives).
Coverage rate of dual-frame telephone sample designs reduced
False positives are basically harmless, aside from the loss in efficiency. False negatives, however, have the potential to reduce the survey coverage rate. This increases the risk of noncoverage error, which is when the people who have a chance to be sampled for a survey differ from those who have no chance of being selected, leading to bias in the survey’s estimates.
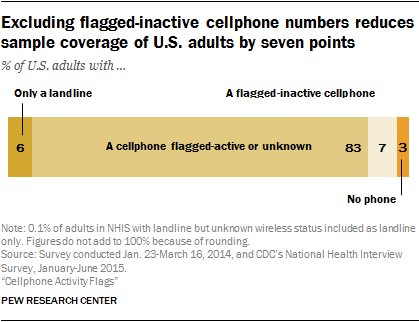
Pew Research Center estimates that 8% of all working, residential cellphones in the U.S. are erroneously flagged inactive, which is several points higher than a previous study reported.3 Taken together with the fact that 91% of U.S. adults own a cellphone, the result is a 7-percentage-point reduction in sample coverage of U.S. adults. For a national cellphone sample, this reduces the estimated net coverage rate of U.S. adults from about 91% to 83%.4
These net rates are based on estimates from the Centers for Disease Control and Prevention’s January to June 2015 National Health Interview Survey that 3% of adults have no telephone and another 6% have a landline but no cellphone. For national RDD surveys of adults, the inclusion of a landline sample substantially mitigates the reduction in coverage from excluding flagged-inactive numbers (from 97% coverage to 93%, rather than 83%).
It is possible to avoid any coverage reduction by using the activity flags to subsample flagged-inactive numbers rather than to wholly exclude them. In other words, despite their being flagged as inactive, the researchers would dial 50% of these numbers and then weight up their results to compensate for the lower sampling rate. Decreased precision and increased cost are two downsides of subsampling with these flags – at least in theory. The weighting adjustment to correct for the subsampling may increase the variance (reflected in an increased design effect5) and thus reduce the precision of survey estimates. Also, subsampling involves retaining some fraction of the flagged-inactive numbers in the sample, which reduces interviewer productivity relative to the exclusion approach. Considering that the activity flag currently costs 7 cents per number to append, the net cost savings may be marginal at best under the subsampling approach.
Respondents with flagged-inactive numbers tended to be younger, less educated, more racially diverse
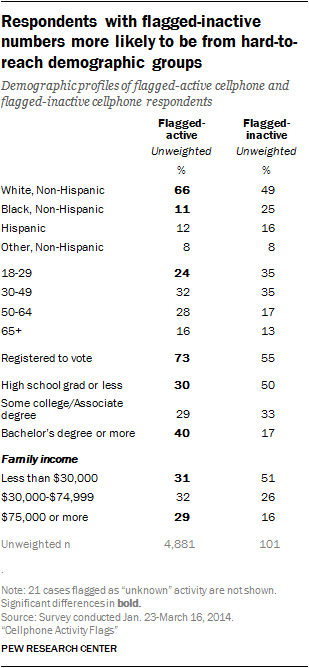
Flagged-inactive respondents are younger, less educated and lower income than flagged-active respondents. They are also more likely to be black non-Hispanic and less likely to be registered to vote or married than flagged-active respondents.
All of these demographic groups are considered hard to reach in surveys because they are less likely to respond. Typically, they are either not found in the resulting respondent sample at the same levels they are found in the population or researchers take great pains in terms of time or cost to have them adequately represented. Excluding or undersampling flagged-inactive cases from the sample means reducing the very respondents that researchers have the hardest time interviewing.
Removing flagged-inactive numbers generally does not affect survey estimates
While excluding flagged-inactive cellphones reduces the survey coverage rate and disproportionately excludes hard-to-reach demographic groups, it does not appear to have a meaningful effect on bias, at least for public opinion surveys. Adults with cellphones erroneously flagged as inactive do differ systematically on several dimensions from those with flagged-active cellphones, as described above, but they constitute too small a fraction of the population to meaningfully move estimates. In the survey, 2% of all cellphone sample interviews and 1% of the combined (cellphone plus landline) sample interviews were with adults reached on numbers erroneously flagged as inactive using the activity flag.
To assess whether excluding or subsampling flagged-inactive phones would have changed the study estimates, researchers created experimental weights simulating each scenario. The weight simulating exclusion precisely followed the survey weighting protocol, but discarded the 101 interviews with flagged-inactive cellphones. The weight simulating subsampling (at a rate of 50%) also followed the survey weighting protocol but discarded a random half of the 101 interviews with flagged-inactive cellphones and weighted up the cases in the non-discarded half by the inverse of the simulated subsampling rate (1/50%=2).
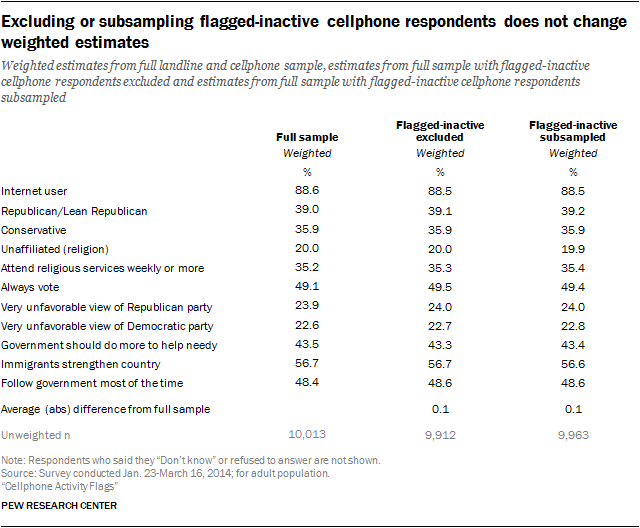
For the 11 common opinion survey questions analyzed, the weighted estimate simulating exclusion or subsampling of flagged-inactive cellphones were virtually indistinguishable from the final weighted survey estimates. The average difference from the final survey estimate was near zero under both the exclusion and the subsampling simulations.
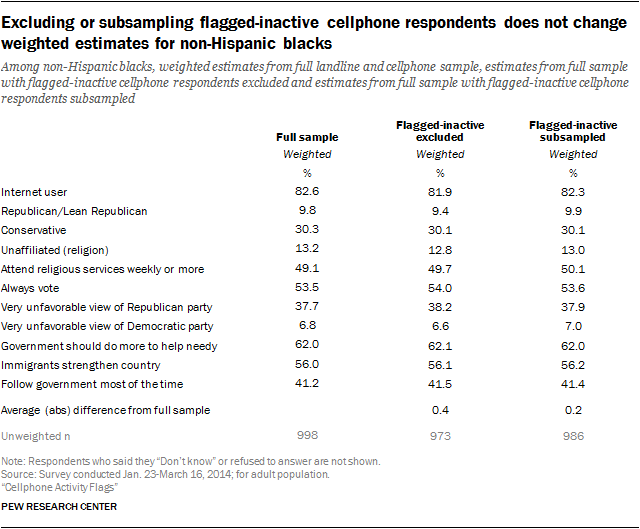
While full sample estimates were basically immune to use of the activity flags, it was not clear if this result would hold for subgroups – particularly subgroups that are more likely to have cellphones erroneously flagged as inactive. To test this, the Center repeated the analysis for blacks and adults ages 18-29. For estimates based on blacks, the average difference from the full sample figures ticked up slightly to 0.4 and 0.2 percentage points in the exclusion and subsampling simulations, respectively.
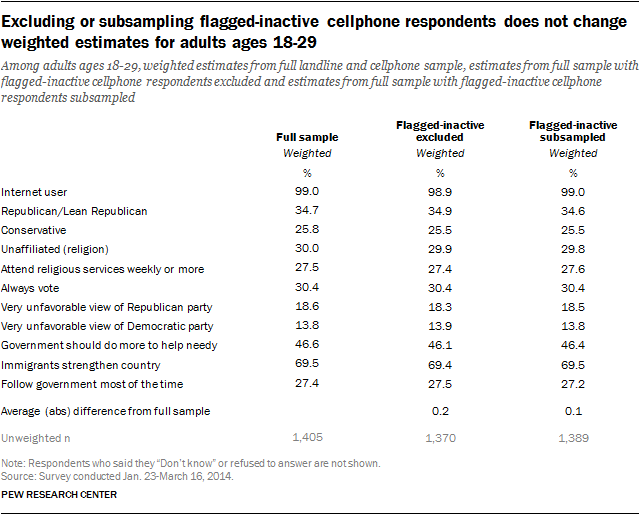
For estimates based on adults ages 18 to 29, the average difference from the full sample figures ticked up slightly to 0.2 and 0.1 percentage points in the exclusion and subsampling simulations, respectively. The overall conclusions, however, did not change. For many public opinion surveys, including most work conducted by Pew Research Center, differences of that magnitude (i.e., less than half a percentage point) are too small to trigger serious concerns about bias.
Cost
Survey designers can exclude or subsample flagged-inactive cases from their samples and, in turn, save money by reducing the amount of time that interviewers spend manually dialing unproductive numbers. One team of researchers6 estimated that excluding flagged-inactive numbers reduced the amount of labor hours needed for telephone interviewing by as much as 20 percent. Some survey research firms now routinely exclude flagged-inactive cellphone numbers from their samples in order to increase efficiency.
Based on this analysis, Pew Research Center decided to forego using activity flags as standard practice in its polling – not out of concern about bias (researchers found very little) but out of concern for the population coverage rate. Maintaining the highest possible coverage rate has always been a priority in the Center’s work. For the time being, the potential efficiency gains do not justify the coverage rate reduction in our studies.


