
The American Trends Panel
The American Trends Panel (ATP), created by Pew Research Center, is a nationally representative panel of randomly selected U.S. adults recruited from landline and cellphone random-digit-dial (RDD) surveys. Panelists participate via monthly self-administered web surveys. Panelists who do not have internet access are provided with a tablet and wireless internet connection. The panel is being managed by GfK.
Data in this report are drawn from the panel wave conducted May 29-June 11, 2018, among 4,594 respondents. The margin of sampling error for the full sample of 4,594 respondents is plus or minus 2.4 percentage points.
The ATP data were weighted in a multistep process that begins with a base weight incorporating the respondents’ original survey selection probability and the fact that in 2014 some panelists were subsampled for invitation to the panel. Next, an adjustment was made for the fact that the propensity to join the panel and remain an active panelist varied across different groups in the sample. The final step in the weighting uses an iterative technique that aligns the sample to population benchmarks on a number of dimensions. Gender, age, education, race, Hispanic origin and region parameters come from the U.S. Census Bureau’s 2016 American Community Survey. The county-level population density parameter (deciles) comes from the 2010 U.S. decennial census. The telephone service benchmark comes from the July-December 2016 National Health Interview Survey and is projected to 2017. The volunteerism benchmark comes from the 2015 Current Population Survey Volunteer Supplement. The party affiliation benchmark is the average of the three most recent Pew Research Center general public telephone surveys. The internet access benchmark comes from the 2017 ATP Panel Refresh Survey. Respondents who did not previously have internet access are treated as not having internet access for weighting purposes. Sampling errors and statistical tests of significance take into account the effect of weighting. Interviews are conducted in both English and Spanish, but the Hispanic sample in the ATP is predominantly native born and English speaking.
The following table shows the unweighted sample sizes and the error attributable to sampling that would be expected at the 95% level of confidence for different groups in the survey:
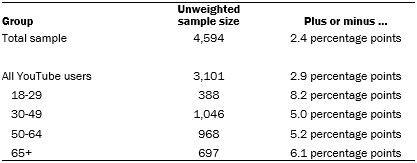
Sample sizes and sampling errors for other subgroups are available upon request.
In addition to sampling error, one should bear in mind that question wording and practical difficulties in conducting surveys can introduce error or bias into the findings of opinion polls.
The May 2018 wave had a response rate of 84% (4,594 responses among 5,486 individuals in the panel). Taking account of the combined, weighted response rate for the recruitment surveys (10.0%) and attrition from panel members who were removed at their request or for inactivity, the cumulative response rate for the wave is 2.4%.4
YouTube video analysis
What are YouTube channels? And why focus on high-subscriber channels?
Much like the profile pages on other social media platforms, YouTube channels function as the owner’s official presence on YouTube and a dedicated homepage for the content the channel owner has posted. Users who are interested in seeing content from a specific “creator” (in other words, a person, company or brand with a presence on YouTube) can subscribe to their channel and automatically see regular updates from them whenever they visit the site.
Researchers chose to examine high-subscriber channels rather than use metrics like a channel’s total video views. This is because subscriber rates are a better measure of a channel’s overall popularity. Channels with high subscriber rates are more likely to regularly produce popular and highly viewed videos, relative to channels with high view counts that could be the product of a single viral video rather than sustained popularity.
The analysis in this report is based on an examination of “random walks” through the videos recommended to viewers of videos on YouTube channels with at least 250,000 subscribers. Because there is no exhaustive or officially sanctioned list of all videos or video channels (of any size) on YouTube, Pew Research Center developed its own custom list of 915,122 YouTube channels and selected the subset of these channels that had at least 250,000 subscribers. This filtered list included a total of 30,481 high-subscriber channels, and these channels were used as the starting points for the random walks through the recommendation network.
Upon completion of the initial random walks data collection, researchers then trained an algorithm to identify English-speaking channels and filtered the random walks down to those that originated on one of 14,509 channels (or 48% of the original list of 30,481 popular channels) that were determined to use English as their primary language. In total, 174,117 random walks began on one of these channels, and these walks were used as the basis for the analysis in the report.
The development of the custom channel list used in this study, as well as the “random walks” analysis used to study the recommendations made by the YouTube algorithm, are each discussed in more detail below.
Channel list development
The custom list of channels used in this study was developed using an iterative, multistep process. First, researchers used the YouTube API to develop an initial list of channels comprised of the following:
- The channels associated with the most popular 50 videos at the time in each video category as defined by the YouTube API
- The most popular 100 channels overall
- The most popular channels at the time in each channel category
Researchers captured the five most-viewed videos from each channel on this initial list, and then captured the top five videos suggested by the YouTube recommendation engine for each of those five most-viewed videos, resulting in 25 video recommendations for each channel. They then collected channel data for each of those 25 videos and repeated the above process once more for any of these channels not on the initial list. Altogether, this process could have identified up to 650 new channels for each channel in the initial list (25 in the first step and 625 in the second).
From the list of channels collected above, researchers used the YouTube API to conduct random walks through the site in search of new channels. Each random walk would perform the following steps:
- Select a channel from this list at random.
- Upon selecting a channel, randomly select one of the top five videos at the time for that channel as ranked by either relevance, date posted, rating, or view count. The criterion used for each walk was chosen randomly prior to selecting a video.
- Randomly select a new video from the top five recommended videos for that video, as listed in the YouTube API at that point in time.
- Using the recommended video as the new starting point, randomly select a new video from that video’s top five recommendations and repeat this step until four recommendations had been followed.
- After five videos had been encountered (the starting video plus four consecutive recommendations), stop the random walk and start a new one.
As the program encountered videos from channels not included in the initial list, those channels would then be added to the list and made available for selection at the start of the next random walk. This process was allowed to run for a period of roughly four months, until few new channels were being identified. In total, researchers conducted 385,187 such random walks through the network over the course of this process, ultimately creating a list of 809,693 channels.
Researchers then once again called the API to select the channels for the top 50 videos in each video category, the top 100 channels overall, and the top channels in each channel category, as was done at the first stage of this process. Researchers also expanded this list of channels with 26,189 additional channels, each with at least 250,000 subscribers, that had been identified in the course of the random walks analysis described above.
For each channel, researchers then repeated the process of identifying the channel’s top five most-viewed videos and collecting the top five video recommendations for each of these videos. Channel data were collected for every new channel that appeared in these recommendations, and any new channel that had at least 250,000 subscribers was added to the ongoing list of channels. Every time the process encountered a video from a channel not in the original list that had at least 250,000 subscribers, that channel would be added and made available for future selection. This entire step was then repeated until no more high-subscriber channels were encountered.
As an additional source of channels that were potentially missing from our initial list, researchers searched the YouTube API for 218 different keywords related to a wide variety of topics and added any channels in the top 50 matches for each keyword (sorted by the API’s internal “relevance” measure) if those channels did not already exist in our database. Researchers also compiled a list of top YouTube channels from online analytics company SocialBlade. This list was created on July 13, 2018, and includes SocialBlade’s top 5,000 influential channels and top 250 YouTubers in the United States, as well as their top channels in the following categories: animals, autos, comedy, education, entertainment, film, games, how to, music, news, nonprofit, people, shows, sports, tech and travel.
Of the overall top 5,000 channels and the top 250 U.S. channels as compiled by SocialBlade, 95% and 96%, respectively, had already been identified in the channel discovery steps we conducted. The channel development had also identified an average of 89% of the channels in the other 16 category lists maintained by SocialBlade. To fill in the remaining gaps, researchers attempted to identify any unique channels found in these SocialBlade lists using the YouTube API, downloaded the channels’ subscriber statistics and added to the sample list any newly identified channels with at least 250,000 subscribers. The random walks analysis was then repeated once more, until no new high-subscriber channels could be identified.
Upon completion of the above steps, the channel database now contained a total of 915,122 channels of any size. After removing any channels with fewer than 250,000 subscribers, the mapping process outlined above ultimately identified a total of 30,481 unique channels with at least 250,000 subscribers. This set of 30,481 channels was then used as the basis for the subsequent collection of individual video recommendations (see next section for details).
‘Random walks’ collection of individual video recommendations
Having defined a list of high-subscriber lists using the process outlined above, researchers then conducted a new random walks analysis to identify individual videos and recommendations within these high-subscriber channels. These random walks also used the YouTube public API and worked in a nearly identical fashion to the ones used to detect new channels during the development of the channel list itself.
First, the process would choose a channel at random from the list of 30,481 starting channels. Next, it would establish a selection criterion at random out of relevance, date posted, user rating or view count and randomly select one of the top five videos in that channel at the time based on that selection criterion. It would then randomly select one of the top five recommended videos listed in the API for that video and repeat that process another three times. At that point, the random walk – consisting of a starting video and four consecutive video recommendations – would be stopped and a new one started.
At each “step” of a given walk, the program would collect a variety of information about the selected video – such as its title, length, number of views, category, date posted or number of comments. The Center conducted 340,244 of these random walks over the period July 18-Aug. 29, 2018.
Filtering to English-speaking channels
As a final step in the analysis after the initial channel selection and random walks process was complete, researchers removed any walks originating from channels for which English was not the primary language. The YouTube API can provide information on the language and country associated with any given channel, but this information is often missing. In order to limit the initial sampling frame to English-speaking YouTube, researchers had to fill in this missing information and identify English-language channels.
Across the entire channel list development and data collection process, researchers collected information on a total of 1,029,859 channels. Of these, 2.6% (26,531) had language information as well as snippet (title/description) and topic tag information. From this subset of channels, researchers drew a sample of 11,874, and then trained an XGBoost classifier to identify English channels using the following features:
- The channel’s country code, if available.
- Binary flags for any topic tags assigned to the channel by the YouTube API.
- Character term frequency-inverse document frequency (TF-IDF) features (60% maximum document frequency, 10 document minimum, 1-5-grams, 15,000 maximum features) based on the title and description of the channel.
- Word TF-IDF features (60% maximum document frequency, 10 document minimum, 1-2-grams, 15,000 maximum features) based on the title and description of the channel.
- Across all random walks in the study that encountered the channel, the proportion of the other channels encountered in those random walks that were flagged for each YouTube language code.
- The probabilities for language predictions based on the “langdetect” Python package, applied to the title and description of the channel.
The classifier was evaluated using 5-fold cross-validation as well as a hold-out sample of 1,188 channels and achieved 90% precision and recall. It was then applied to all channels that had missing language information. Finally, using the new language predictions, the initial set of 340,244 random walks was filtered down to those that started on an English language channel (47% of the initial seed channels were determined to be non-English), resulting in a final total of 174,117 random walks, each of which started from one of 14,509 English language channels. In total, these random walks encountered 696,468 video recommendations to 346,086 unique videos.
© Pew Research Center, 2018


