
Annual Gadgets Survey 2007
Final Topline, 12/13/07
Data for October 24 – December 2, 2007
Princeton Survey Research Associates International for the Pew Internet & American Life Project
Sample: n = 2,054 adults 18 and older, including 500 cell phone users
Interviewing dates: 10.24.07 – 12.2.07
- Margin of error is plus or minus 2 percentage points for results based on total sample [n=2,054]
- Margin of error is plus or minus 3 percentage points for results based on internet users [n=1,572]
- Margin of error is plus or minus 3 percentage points for results based on landline and form 1 cell sample [n=1,804]
- Margin of error is plus or minus 3 percentage points for results based on landline and form 2 cell sample [n=1,804]
- Margin of error is plus or minus 3 percentage points for results based on landline only [n=1,554]
Q43 Please tell me if each of the following statements describes you very well, somewhat well, not too well or not at all. (READ AND ROTATE)
Based on internet users or those who have a cell phone or Blackberry
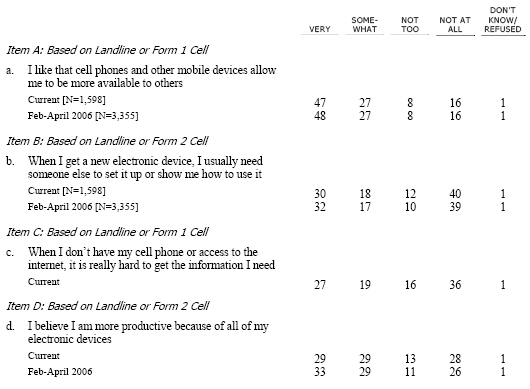
[INSERT ITEM]
Based on Landline respondents only
[INSERT ITEM]
Q45 Which one of these failed to work most recently?
[N=409]
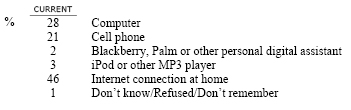
[INSERT NAMED OF FAILED DEVICE]
[N=734]
[INSERT NAMED OF FAILED DEVICE]
[INSERT NAMED OF FAILED DEVICE]
[N=734]
[INSERT NAMED OF FAILED DEVICE]
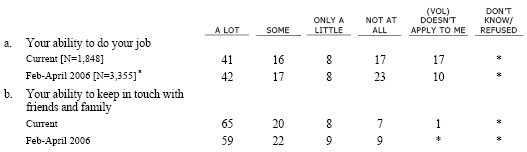
Q48 How much, if at all, have these communication and information devices improved…(INSERT; ROTATE) – a lot, some, only a little, or not at all?5
Based on internet users or those who have a cell phone or Blackberry
Methodology
The Annual Gadgets Survey, sponsored by the Pew Internet and American Life Project, obtained telephone interviews – both landline and cell phone – with a nationally representative sample of 2,054 adults living in the continental United States. The survey was conducted by Princeton Survey Research International. The interviews were conducted in English by Princeton Data Source, LLC from October 24 to December 2, 2007. Statistical results are weighted to correct known demographic discrepancies. The margin of sampling error for the complete set of weighted data is ±2.4%.
A combination of landline and cellular random digit dial (RDD) samples was used to represent all adults in the continental United States who have access to either a landline or cellular telephone. Random phone numbers for the landline sample were generated from active blocks (area code + exchange + two-digit block number) that contained three or more residential directory listings. Active blocks were chosen with probabilities in proportion to their share of listed telephone households. The cellular sample was not list-assisted, but was drawn through a systematic sampling from 1000-blocks dedicated to cellular service according to the Telcordia database.


