
Parent and Teen Survey on Gaming and Civic Engagement
Summary59
The Parent and Teen Survey on Gaming and Civic Engagement, sponsored by the Pew Internet and American Life Project, obtained telephone interviews with a nationally representative sample of 1102 12- to 17-year-olds and their parents in continental U.S. telephone households. The survey was conducted by Princeton Survey Research International. Interviews were done in English by Princeton Data Source, LLC, from November 1, 2007, to February 5, 2008. Statistical results are weighted to correct known demographic discrepancies. The margin of sampling error for the complete set of weighted data is ±3.2%.
Details on the design, execution and analysis of the survey are discussed below, along with details of the procedures used to code games and their ratings.
Design and Data Collection Procedures
Sample Design: The sample was designed to represent all teens ages 12-17 living in continental U.S. telephone households. The telephone sample was provided by Survey Sampling International, LLC (SSI) according to PSRAI specifications. The sample was drawn using standard list-assisted random digit dialing (RDD) methodology. Active blocks of telephone numbers (area code + exchange + two-digit block number) that contained three or more residential directory listings were selected with probabilities in proportion to their share of listed telephone households; after selection two more digits were added randomly to complete the number. This method guarantees coverage of every assigned phone number regardless of whether that number is directory listed, purposely unlisted, or too new to be listed. After selection, the numbers were compared against business directories and matching numbers purged.
Contact Procedures: Interviews were conducted from November 1, 2007 to February 5, 2008. As many as 10 attempts were made to contact every sampled telephone number. Sample was released for interviewing in replicates, which are representative subsamples of the larger sample. Using replicates to control the release of sample ensures that complete call procedures are followed for the entire sample. Calls were staggered over times of day and days of the week to maximize the chance of making contact with potential respondents. Each household received at least one daytime call in an attempt to find someone at home.
In each contacted household, interviewers first determined if a child age 12-17 lived in the household. Households with no children in the target age range were screened out as ineligible. For eligible households, interviewers first conducted a short interview with a parent or guardian and then interviews were conducted with the target child.60
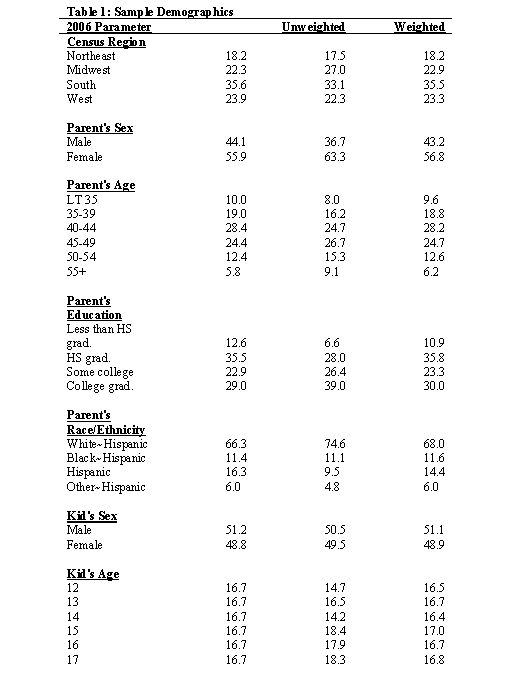
Weighting and analysis: Weighting is generally used in survey analysis to compensate for patterns of nonresponse that might bias results. The interviewed sample of all adults was weighted to match national parameters for both parent and child demographics. The parent demographics used for weighting were: sex; age; education; race; Hispanic origin; and region (U.S. Census definitions). The child demographics used for weighting were gender and age. These parameters came from a special analysis of the Census Bureau’s 2006 Annual Social and Economic Supplement (ASEC) that included all households in the continental United States that had a telephone.
Weighting was accomplished using Sample Balancing, a special iterative sample weighting program that simultaneously balances the distributions of all variables using a statistical technique called the Deming Algorithm. Weights were trimmed to prevent individual interviews from having too much influence on the final results. The use of these weights in statistical analysis ensures that the demographic characteristics of the sample closely approximate the demographic characteristics of the national population. Table 1 compares weighted and unweighted sample distributions to population parameters.
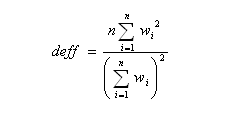
Effects of Sample Design on Statistical Inference: Post-data collection statistical adjustments require analysis procedures that reflect departures from simple random sampling. PSRAI calculates the effects of these design features so that an appropriate adjustment can be incorporated into tests of statistical significance when using these data. The so-called design effect or deff represents the loss in statistical efficiency that results from systematic non-response. The total sample design effect for this survey is 1.17.
PSRAI calculates the composite design effect for a sample of size n, with each case having a weight, wi as:
In a wide range of situations, the adjusted standard error of a statistic should be calculated by multiplying the usual formula by the square root of the design effect (√deff ). Thus, the formula for computing the 95% confidence interval around a percentage is:
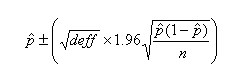
where pˆ is the sample estimate and n is the unweighted number of sample cases in the group being considered.
The survey’s margin of error is the largest 95% confidence interval for any estimated proportion based on the total sample— the one around 50%. For example, the margin of error for the entire sample is ±3.2%. This means that in 95 out every 100 samples drawn using the same methodology, estimated proportions based on the entire sample will be no more than 3.2 percentage points away from their true values in the population. The margin of error for teen internet users is ±3.3% and for teen game players is ±3.2%. It is important to remember that sampling fluctuations are only one possible source of error in a survey estimate. Other sources, such as respondent selection bias, questionnaire wording and reporting inaccuracy, may contribute additional error of greater or lesser magnitude.
Response Rate
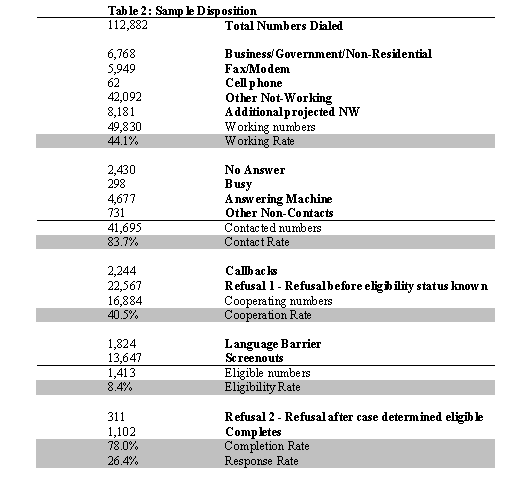
Table 2 reports the disposition of all sampled telephone numbers ever dialed from the original telephone number sample. The response rate estimates the fraction of all eligible respondents in the sample that were ultimately interviewed. At PSRAI it is calculated by taking the product of three component rates:61
- Contact rate — the proportion of working numbers where a request for interview was made—of 84 percent62
- Cooperation rate—the proportion of contacted numbers where a consent for interview was at least initially obtained, versus those refused—of 41 percent
- Completion rate—the proportion of initially cooperating and eligible interviews that were completed—of 78 percent
Thus the response rate for this survey was 26 percent.
Open-Ended Response Coding Instructions63
In coding the open ended responses to our “What are your current top three favorite games?” question, we used two people to count the frequency of each of the individual game titles named by the respondents in the survey. The two coders then reconciled their findings to make sure their numbers and their interpretations of the misspelled games were consistent. We then compiled a master list of all of the spelling “transformations” we made as well as a list of responses that we could not find in our game search or found to be ambiguous. We then sorted all of the games into six categories:
- Games with ratings: The majority of the games listed in the survey as respondents’ top three favorite games are console games that are reviewed and rated by the Electronic Software Rating Board (ESRB).
- Unrated games: Many of the games that teens play are online flash games, downloaded games, or games played on a computer from a CD, all of which are unregulated by the ESRB, and thus, unrated. There are 78 unrated games in this survey. In some cases, teens simply listed the website where they go to play games (such as www.miniclip.com or www.pogo.com).
- Game titles we could not find: Some titles we could not decipher, did not exist in the ESRB database, the ESA spread sheet, and were not Google-able. Other titles were ambiguous and could point to different games. For instance, “hearts 2” could be a second electronic version of the card game “hearts,” or it could refer to “kingdom hearts 2.” There were 59 game titles listed by survey respondents that we could not find.
- General game genres: Some respondents listed a genre of games, such as “racing games,” rather than a specific title as one of their three favorite games. There are 149 responses that were unspecific.
- Don’t know: Respondents who answered with different versions of don’t know or who listed games that had not been released at the time of the survey
- Transformation of misspelled games: Some game titles were written down incorrectly, but we were able to guess with a large degree of certainty what the real title the respondent was referring to. For example: the game “Metroid Crime” does not exist, however, “Metroid Prime” is a popular Nintendo game rated T for teen.
Coding Game Ratings
The majority of the games in the survey are rated by the ESRB. However, we encountered several problems when we sorted the games and recorded their assigned ratings:
- The largest problem that we found is that there are multiple ratings for the same game and the ratings vary based on the equipment used to play the game.
- There are 101 games in this survey that have multiple ratings.
- In order to deal with multiple ratings, each rating was given a value from 0 to 5 (EC=0, E=1, E10+=2, T=3, M=4, AO=5) and we averaged the ratings of the games listed under that title on the ESRB website together. For example, if there were 14 versions of Tony Hawk Pro Skater, two of them were rated E, five of them were rated E10+, and seven were rated T, then that would be an average rating of 2.21.
Coding the Individual Respondent Game Ratings
In order to determine the rating for each respondent, we used the list of game ratings that we compiled earlier and averaged the ratings for all of the games that the respondent listed. For respondents who did not list any games, who played games we could not find in our initial search, or who only played unrated online or PC games, we marked them as “9.”
As we noted earlier, one of the more difficult aspects of this coding is that most of the individual games have multiple ratings depending on the devices used to play the game. For instance, The Sims 2 is rated E10+ (meaning it is deemed appropriate for kids age 10 and older) on the Nintendo DS, but the version for the Sony PSP is rated T for teen (meaning the ESRB has deemed it appropriate for ages 13 and older). We averaged the ratings that correlated with the game titles that each respondent listed, but since we do not know which specific device the respondent used to play the game (or whether he or she used multiple devices) the ratings for each game are averages of all the possible ratings for the game title. For further information, see the “Coding Ratings” section. In keeping with our system of converting the ratings to numerical values (ec=0, e=1, e10+=2, t=3, m=4, ao=5), the average game rating for the respondents range from 0-5.
Coding for M- and/or AO-Rated Games
There are many games in our survey with at least one version that has an M or AO rating. In order to track the teens who play these games, we created a variable that kept track of how many games with an M or an AO rated version each respondent plays. This variable is potentially skewed, because as we explained earlier, many games have multiple ratings. This variable assumes that the respondent is playing the version of the game with the M or AO rating. Some of the games have versions with less mature ratings, and we have no way of knowing which version the respondent is playing, or if the respondent plays multiple versions, each with a different rating.
Coding for Top Five Game Franchises
We coded for the top five video game franchises rather than the top five favorite games because analyzing according to franchise yielded larger base sizes, which allows for more in-depth analysis.
In coding for the top five franchises, we created five dichotomous variables with a “1” to indicate if the respondent said they played a game in the franchise, and a “0” if they either did not name a particular game in that franchise, or if they did not provide any game titles.


