
Analysis of state trends from 2007 to 2010 indicates that four states had a statistically significant decline in their populations of unauthorized immigrants, and the combined population of three other contiguous states in the Mountain West decreased. There was a statistically significant increase in the combined population of three contiguous West South Central states. No other states had statistically significant change over this period.
The four individual states where the number of unauthorized immigrants declined from March 2007 to March 2010 were New York, Florida, Virginia and Colorado. Additionally, the combined unauthorized immigrant population in Arizona, Nevada and Utah also decreased during that period, although the change was not statistically significant for any of those states individually.
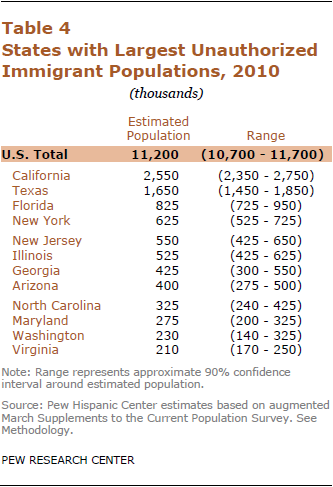
Florida had an estimated 825,000 unauthorized immigrants in 2010, a decline from 1.05 million in 2007. Nevertheless, Florida continued to rank third among states in the size of its unauthorized immigrant population. New York’s estimated unauthorized immigrant population in 2010, 625,000, declined from an estimated 825,000 in 2007. New York ranked fourth in the size of its unauthorized population in 2010, as it did in 2007.
There were an estimated 210,000 unauthorized immigrants living in Virginia in 2010, a decline from 325,000 in 2007. In Colorado, an estimated 180,000 unauthorized immigrants lived in the state in 2010, compared with 240,000 in 2007.
In the Mountain West, the combined unauthorized immigrant population of Arizona, Nevada and Utah declined to an estimated 700,000 from an estimated 850,000 in 2007.
Counter to the national trend, the combined unauthorized immigrant population grew in some West South Central states. In 2007, Louisiana, Oklahoma and Texas had a combined 1.55 million unauthorized immigrants living within their borders. In 2010, that number had grown to 1.8 million. Texas, with an unauthorized immigrant population of 1.65 million, ranks second only to California in the size of this group.
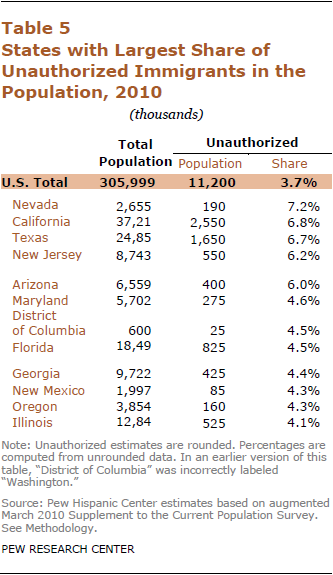
California has by far the largest unauthorized-immigrant population (2.55 million). It also is among the states where unauthorized immigrants constitute the largest shares of the overall populations. In addition to California (6.8%), other top states are Nevada (7.2%) and Texas (6.7%).
Unauthorized immigrants are concentrated in a relatively small number of states. The dozen states with the largest unauthorized numbers account for more than three-quarters (77%) of this population. Nearly a quarter (23%) lives in California. Nonetheless, unauthorized immigrants live in every state, and several of their top destinations, including Georgia and North Carolina, housed relatively few unauthorized immigrants two decades ago.
Mexicans account for half or more of the unauthorized population in all but 22 states and Washington, D.C. In seven states, they make up 80% or more of the unauthorized immigrant population. At the national level, 58% of unauthorized immigrants are Mexicans.
Among the five states with the largest unauthorized populations, Mexicans constitute less than half the stock in three of them—New York, New Jersey and Florida.
Because of small sample size in many states and potentially large sampling variability, some state estimates presented here are based on multiyear averages. For the 34 states with fewer than 50 cases of unauthorized immigrant households in the 2010 sample survey, the estimates for that year are an average of 2009 and 2010. These states are Alabama, Alaska, Arkansas, Delaware, Hawaii, Idaho, Indiana, Iowa, Kansas, Kentucky, Louisiana, Maine, Massachusetts, Michigan, Minnesota, Mississippi, Missouri, Montana, Nebraska, New Hampshire, New Mexico, North Dakota, Ohio, Oklahoma, Pennsylvania, Rhode Island, South Carolina, South Dakota, Tennessee, Utah, Vermont, West Virginia, Wisconsin and Wyoming. Estimates for other states and for the District of Columbia are based solely on 2010 data.
All 2007 state estimates were derived by calculating the average share of the national unauthorized immigrant population for 2006-2008 that was held by each state, then applying that share to the 2007 national total.


