A rising share of Americans say the availability of affordable housing is a major problem in their local community. In October 2021, about half of Americans (49%) said this was a major problem where they live, up 10 percentage points from early 2018. In the same 2021 survey, 70% of Americans said young adults today have a harder time buying a home than their parents’ generation did.
A variety of factors have set the stage for the financial challenges American homeowners and renters have been facing in the housing market, including incomes that haven’t kept pace with housing cost increases and a housing construction slowdown. A surge in homebuying spurred by record low mortgage interest rates during the COVID-19 pandemic has further strained the availability of homes.
Here are some of the key measures of the housing affordability crunch in the United States and the reasons behind it.
This Pew Research Center analysis about housing affordability in America draws from Center surveys designed to understand Americans’ views and preferences for where they live. It also uses outside data from sources including the Federal Reserve Bank and the U.S. Census Bureau.
Everyone who took the Pew Research Center surveys cited is a member of the Center’s American Trends Panel (ATP), an online survey panel that is recruited through national, random sampling of residential addresses. This way nearly all U.S. adults have a chance of selection. The survey is weighted to be representative of the U.S. adult population by gender, race, ethnicity, partisan affiliation, education and other categories. Read more about the ATP’s methodology.
Rising demand for housing meets limited supply
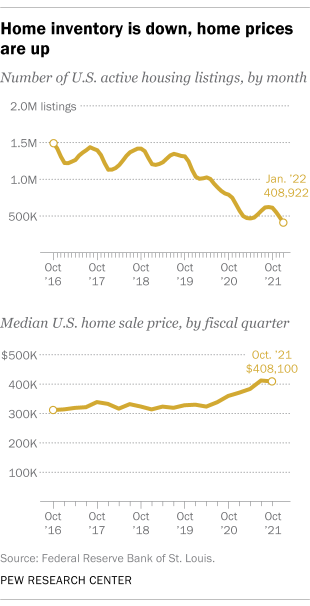
- As home sales have boomed, active housing listings have dropped and the median home sale price has surged, according to data from the Federal Reserve. The number of active housing listings in the U.S. was at its lowest in at least five years in January 2022, with 408,922 active listings on the market. That’s a 60% drop from about 1 million listings in February 2020, just before the coronavirus recession hit the U.S.
Around the same time, the national median sale price for a single-family home jumped 25% from $327,100 in the fourth quarter of 2019 (the last full quarter unaffected by the COVID-19 recession) to $408,100 in the fourth quarter of 2021, the most recent data available. The greatest increases were in the West, Midwest and Northeast.
Housing vacancy rates, meanwhile, have dropped over the last decade. The vacancy rate for rental units fell from about 10% in 2010 to 5.6% at the end of 2021. The rate for homeowner units is down from about 2.6% in 2010 to 0.9% in 2021 (the most recent year with available data).
- Housing availability has been squeezed by a near-record increase in the number of American homeowners in 2020, a Pew Research Center analysis of U.S. Census Bureau data found. There were an estimated 2.1 million more homeowners in the fourth quarter of 2020 than there were a year earlier, equal to the previous record increase in homeowners, which occurred during the housing boom between 2003 and 2004.
During 2020, the U.S. homeownership rate also increased to 65.8%, up from 65.1% a year earlier – a large year-over-year change, but still below the historical peak of 69.2% in 2004. The homeownership rate in the fourth quarter of 2021 (65.5%) was not statistically different from the rates in the fourth quarter of 2020 (65.8%) and the third quarter of 2021 (65.4%).
Homeownership among households headed by White Americans rose an estimated 0.8 points from 2019 to 2020 – the only racial or ethnic group to see a statistically significant increase during that time. (Homeownership rates did not significantly increase for any racial or ethnic group between 2020 and 2021).
In the fourth quarter of 2021, 74% of White adults owned a home, compared with 43% of Black Americans and 48% of Hispanic Americans. These disparities in homeownership have persisted over decades.
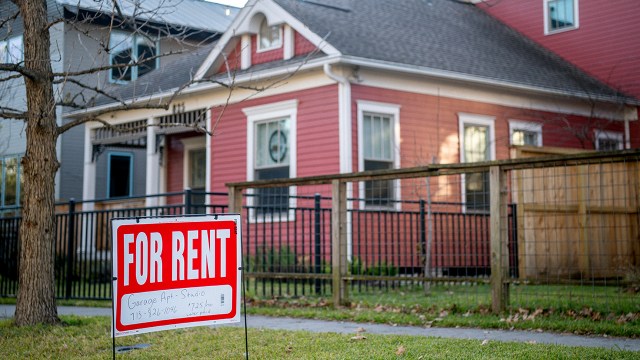
Renters are feeling the strain
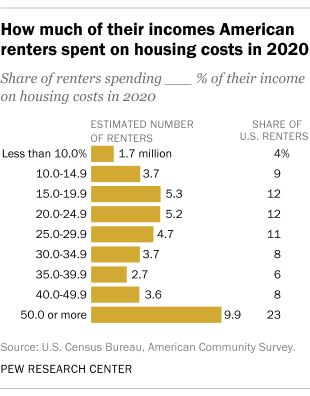
- In 2020, 46% of American renters spent 30% or more of their income on housing, including 23% who spent at least 50% of their income this way, according to the most recent data available from the U.S. Census Bureau. This meets the Department of Housing and Urban Development’s definition of being “cost burdened.” Although spending 30% of income on housing has long been considered the most a household should spend in order to have money left over for essentials, some researchers have argued this housing affordability measure should be adjusted to reflect changes in the cost of other necessities, types of households and other factors.
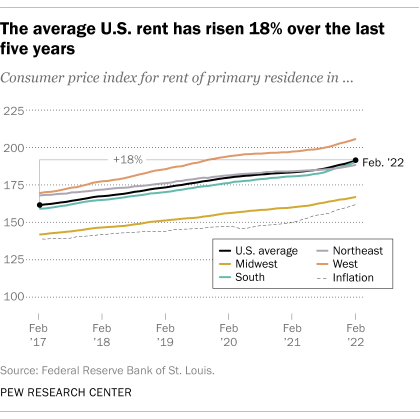
- Renters across the U.S. have seen the average rent rise 18% over the last five years, outpacing inflation, according to consumer price index data from the Bureau of Labor Statistics. Between 2017 and 2022, the cost of all goods and services increased by 16% due to inflation. During that span, the growth in rent prices exceeded inflation in every region but the Northeast: The average rent rose 21% in the West, 20% in the South and 18% in the Midwest. Rents were up 12% in the Northeast during that time.
From February 2020 to February 2022, rents were up 6%, compared with a 10% inflation rate amid loosening coronavirus restrictions.
- Renters tend to skew toward the lower ends of the economic scale when it comes to income and wealth, according to data from the Federal Reserve’s 2019 Survey of Consumer Finances. That year, about six-in-ten Americans in the lowest income quartile (61%) rented their homes, as did 88% of people with net worths below the 25th percentile. People with lower incomes or net worths were more likely to be renters: Only 10.5% of people in the top income quartile, for example, were renters.
Younger Americans and those who are Black or Hispanic are more likely to be renters, according to an August 2021 Pew Research Center analysis of U.S. Census Bureau data. Roughly a third of U.S. households (35%) were headed by renters in 2021, the last year for which the U.S. Census Bureau has reliable estimates. Households headed by Black or African American adults are more likely than the population overall to rent their homes (57% rent), along with 52% of Hispanic- or Latino-led households. Around a quarter of households led by non-Hispanic White adults (26%) rent.
Americans younger than 35 are far more likely to rent than those in older age groups: 62% of this age group lives in rentals compared with 39% of those ages 35 to 44, and 30% of 45- to 54-year-olds.
- Looking ahead, Americans anticipate continued rent increases in 2022, according to the Federal Reserve Bank of New York’s Survey of Consumer Expectations. Americans expect that rents will increase by 10% this year – that’s larger than the expected increase in price for any other commodity, including food (9.2%), college education (9.0%) and gas (8.8%).
