As 2021 draws to a close, here are some of Pew Research Center’s most striking research findings from the past year. These 15 findings cover subjects ranging from extreme weather to the COVID-19 pandemic and ongoing demographic shifts in the United States. And they represent just a small slice of the year’s full list of research publications.
A growing share of childless Americans say it is unlikely they will ever have children, an October survey found. Some 44% of non-parents ages 18 to 49 say it is not too or not at all likely that they will have children someday, an increase from the 37% who said the same in 2018. Meanwhile, 74% of adults younger than 50 who are already parents say they are unlikely to have more kids, virtually unchanged since 2018.
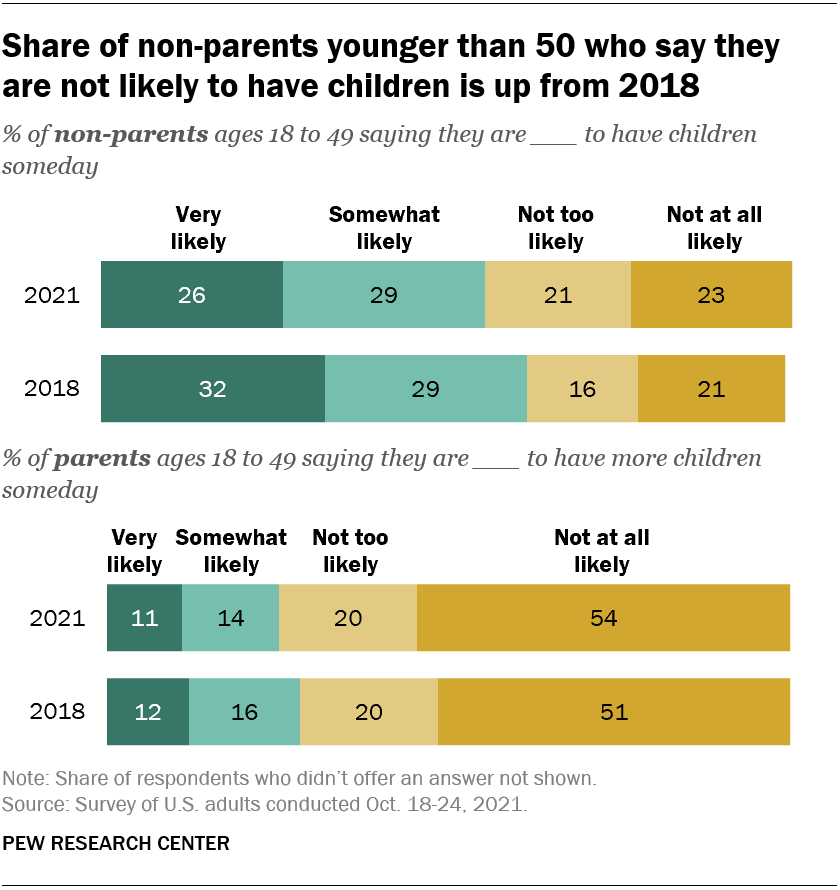
What’s behind the growing share of non-parents younger than 50 who expect not to have children? A majority (56%) say a major reason is that they just don’t want to. Among those who point to some other reason, about two-in-ten (19%) say it’s due to medical reasons, 17% say it’s for financial reasons and 15% say it’s because they do not have a partner. Roughly one-in-ten point to their age or their partner’s age (10%), or to the state of the world (9%).
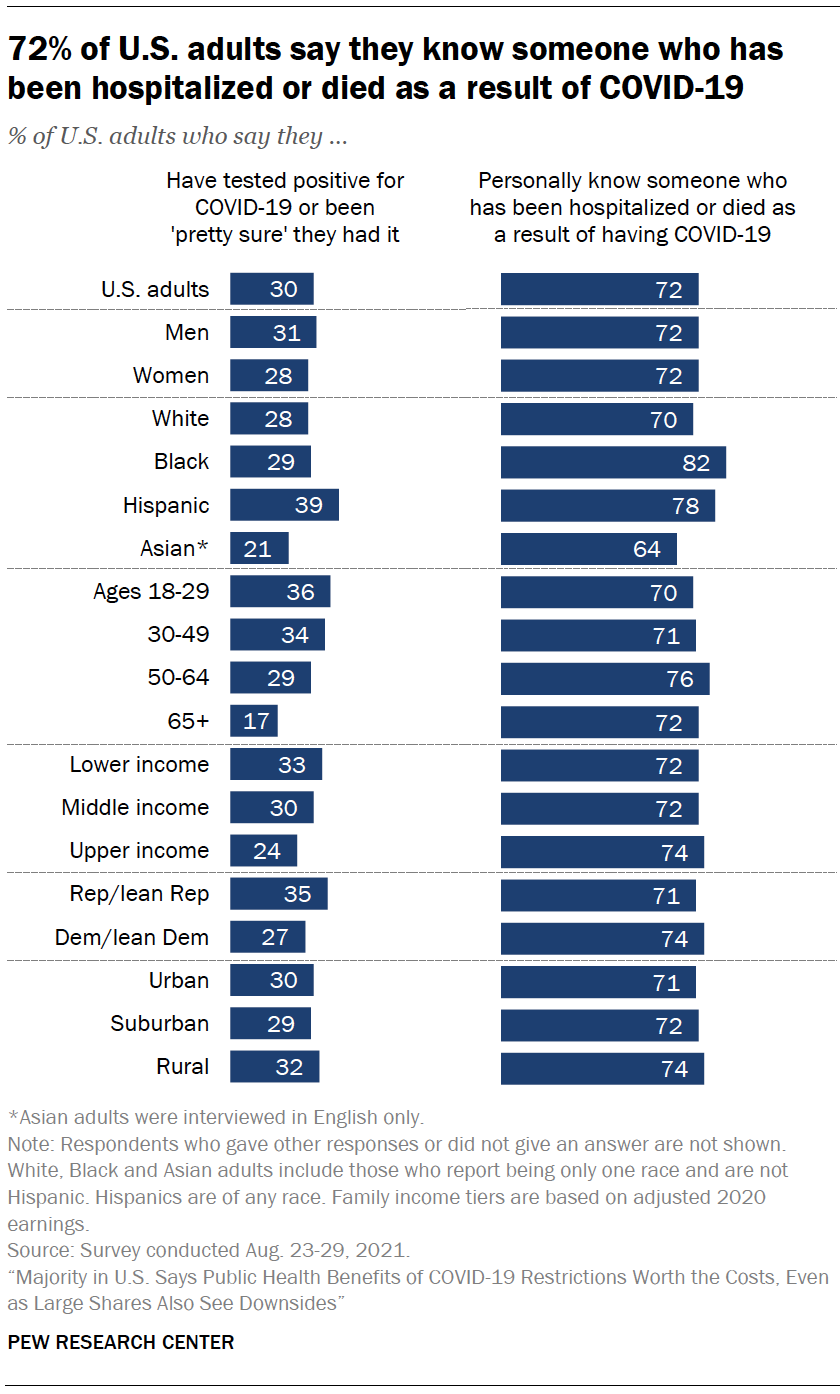
Around seven-in-ten U.S. adults (72%) said in an August survey that they personally know someone who has been hospitalized or died from COVID-19. As has been the case throughout the COVID-19 outbreak, larger shares of Black (82%) and Hispanic (78%) adults than White (70%) and English-speaking Asian adults (64%) said they personally know someone who had been hospitalized or died as a result of the coronavirus.
Across other major demographic groups, there were modest or no differences in the shares who say this. Democrats and Democratic-leaning independents, for example, were about as likely as Republicans and GOP leaners to say they know someone who had been hospitalized or died (74% and 71%, respectively).
More than 600,000 Americans had died from the virus at the time of the August survey. Since then, the death toll has risen to more than 800,000.
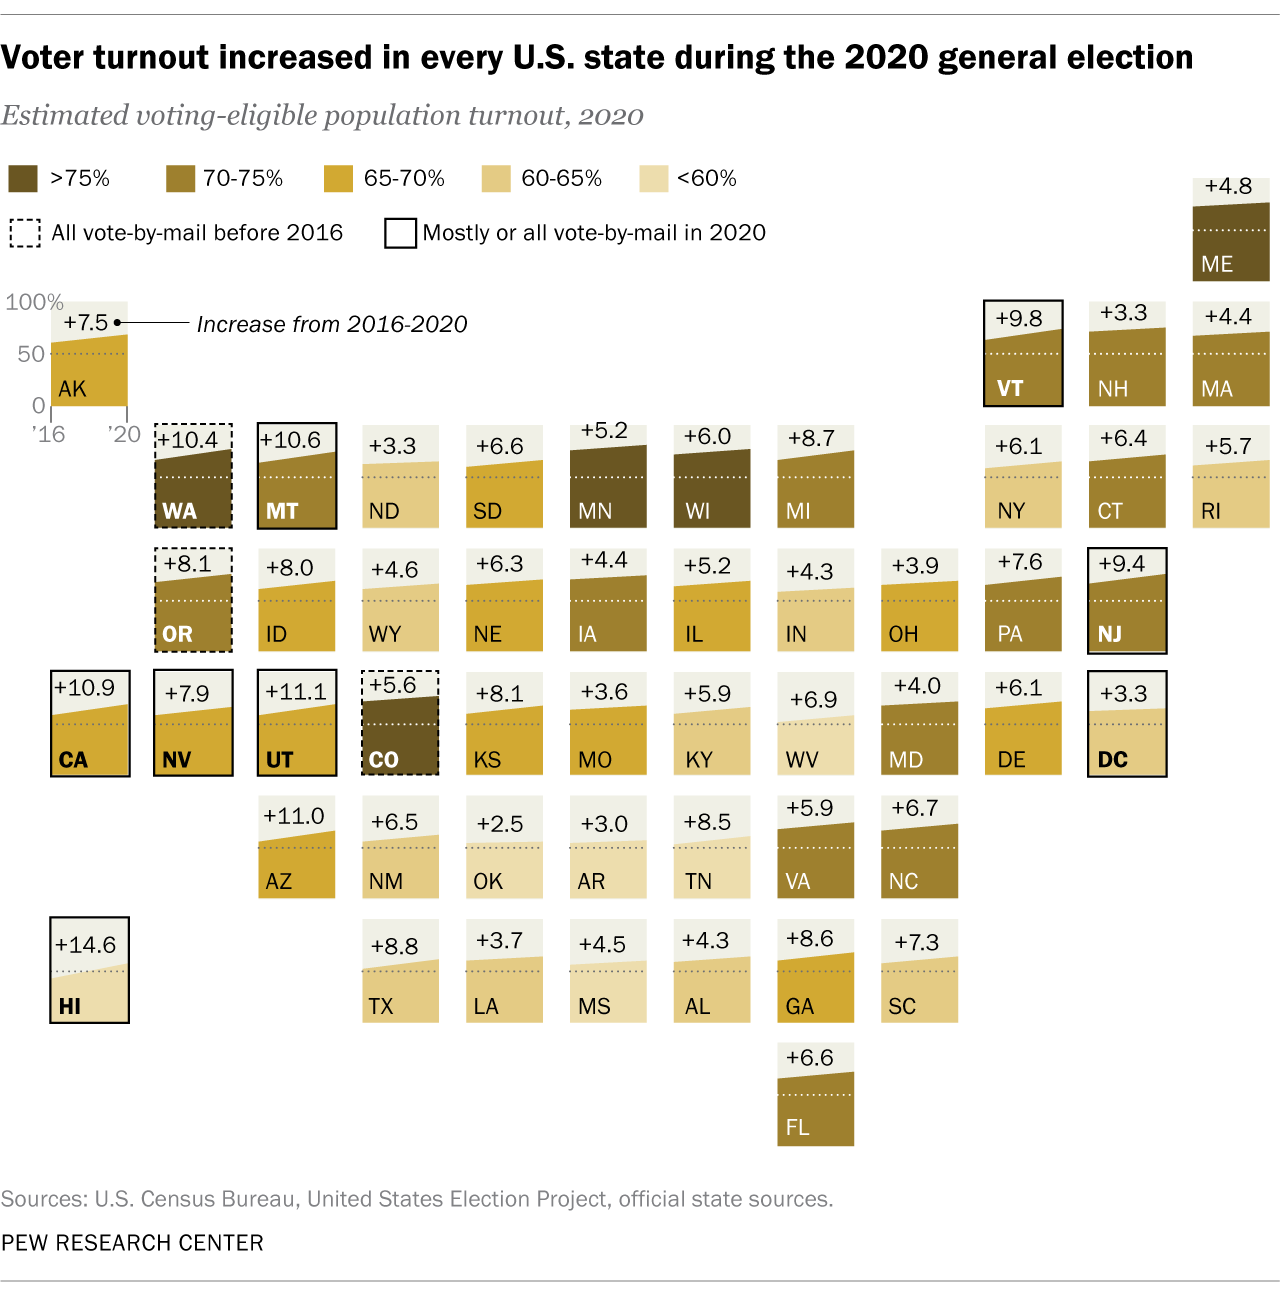
Americans voted in record numbers in the 2020 presidential election, as turnout rose in every state, according to a January analysis by the Center. Nearly two-thirds of the estimated number of eligible voters and more than six-in-ten people of voting age cast ballots in the election.
Nationwide, presidential election turnout was about 7 percentage points higher than in 2016, regardless of which of three different turnout metrics we looked at. Turnout rates increased in every state compared with 2016, but of the 10 states where it rose the most, seven conducted the vote entirely or mostly by mail.
Minnesota had the highest turnout of any state, with 79.4% of estimated eligible voters casting ballots for the presidential election. Colorado, Maine and Wisconsin all followed close behind at about 75.5%; Washington state, at 75.2%, rounded out the top five. The lowest-turnout states were Tennessee (59.6% of estimated eligible voters), Hawaii and West Virginia (57% each), Arkansas (55.9%) and Oklahoma (54.8%).
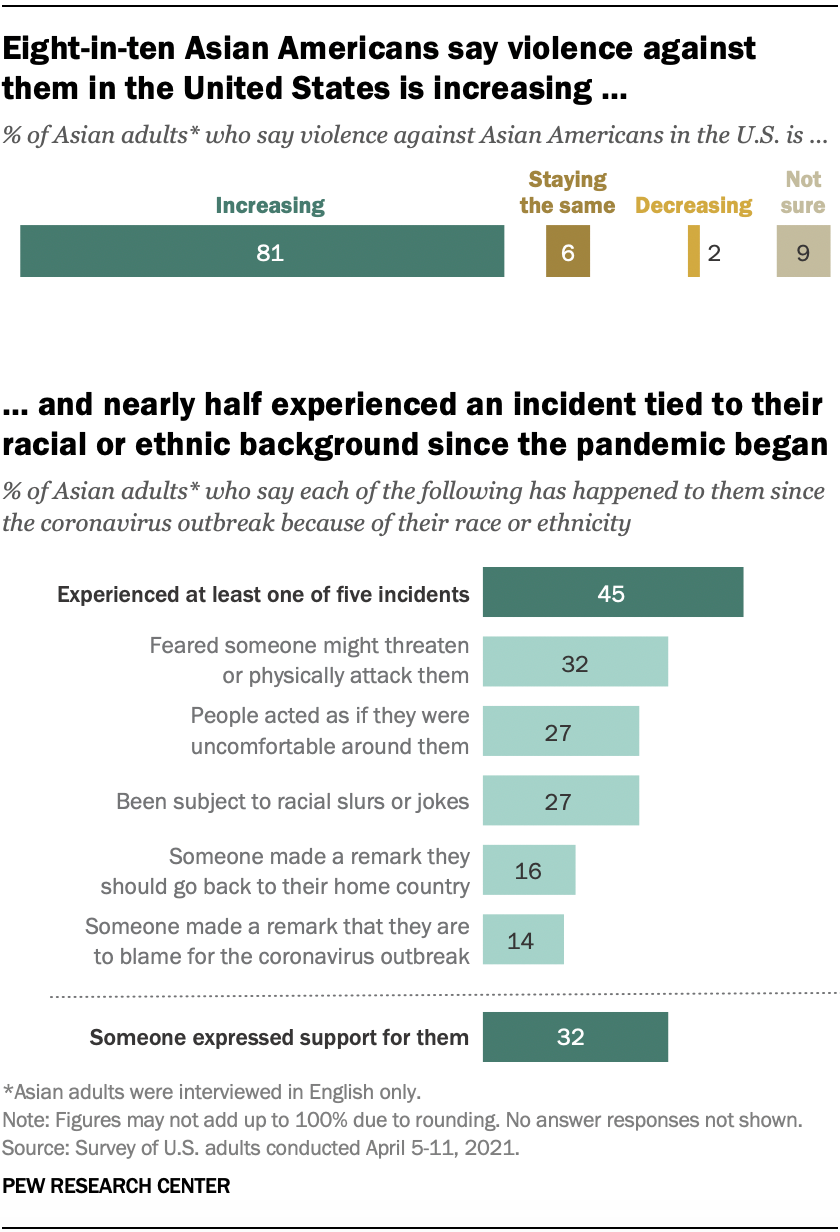
About eight-in-ten Asian Americans say violence against them is increasing in the U.S., an April survey found. The survey was fielded after the fatal shooting of six Asian women and two other people in the Atlanta area in March, and following other assaults on Asian Americans.
Amid widespread reports of discrimination and violence against Asian Americans during the coronavirus outbreak, 45% of Asian adults said they had experienced at least one of five specific types of incidents since the start of the pandemic.
Around a third (32%) said they had feared someone might threaten or physically attack them – a greater share than among people in other racial or ethnic groups who said this. Some 27% of Asian adults said people had acted as if they were uncomfortable around them. Another 27% said they had been subject to slurs or jokes. Lower shares said someone had made a remark that they should go back to their home country (16%) or that they were to blame for the coronavirus outbreak (14%).
At the same time, 32% said someone has expressed support for them since the start of the pandemic.
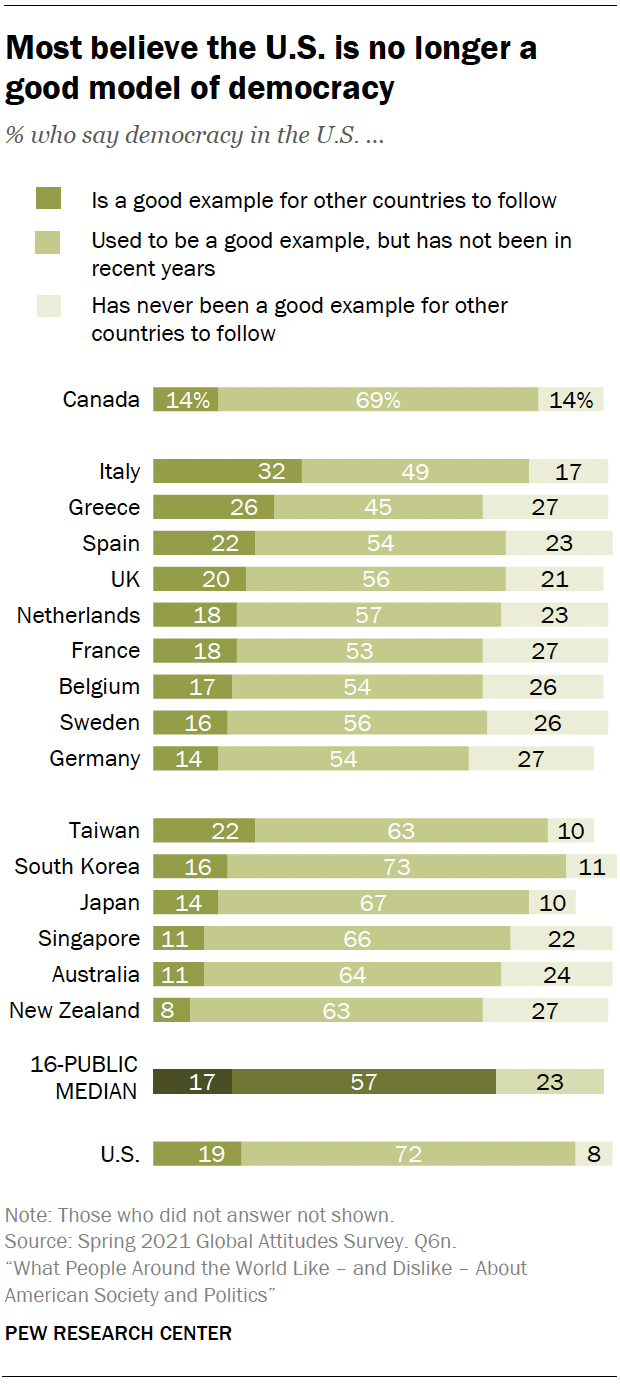
Across 16 publics surveyed in spring 2021, a median of just 17% of adults said democracy in the U.S. is a good example for other countries to follow. A median of 57% said American democracy used to be a good example for other countries to follow but has not been in recent years. A median of 23% said American democracy has never been a good example for other countries to follow.
Americans largely shared the view that their country is no longer a good model of democracy: 72% said U.S. democracy used to be a good example for others to follow but has not been recently. Democrats and Democratic leaners were twice as likely as their Republican and GOP leaning counterparts to say the U.S. has never been a good model of democracy.
More broadly, the U.S. political system also received generally lukewarm ratings across the 16 advanced economies surveyed. People were split on how the system is functioning, with a median of 50% saying it works well and 48% who disagreed.
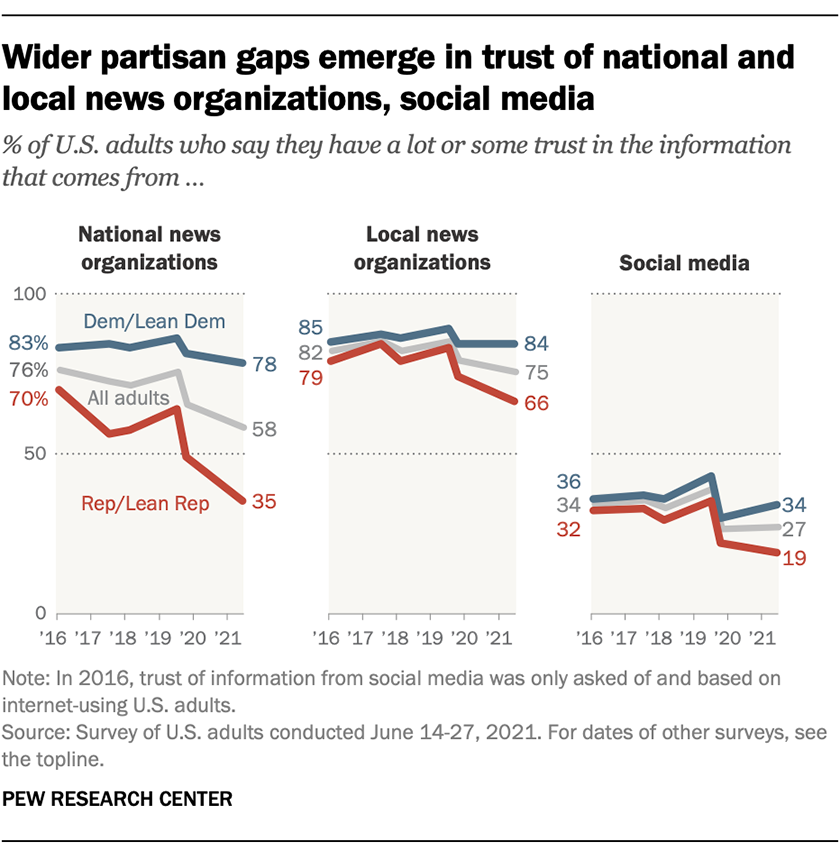
In just five years, the percentage of Republicans with at least some trust in national news organizations has fallen by half – dropping from 70% in 2016 to 35% this year, a June survey found.
Democrats remain far more likely than Republicans to say they have a lot or some trust in the information that comes from national news organizations (78% vs. 35%). The 43-point partisan gap is the widest measured since at least 2016.
Women in the U.S. are now more likely than men to have a four-year college degree, according to a November analysis. Around four-in-ten women ages 25 and older (39%) have a bachelor’s degree, compared with a slightly smaller share of men in the same age group (37%). Among those ages 25 to 34 specifically, women are now 10 percentage points more likely than men to have a bachelor’s degree (46% vs. 36%).
The reasons for not completing a four-year degree differ for men and women, according to an accompanying survey of adults who do not have such a degree and are not currently enrolled in college. Men are more likely than women to point to factors that have more to do with personal choice. Roughly a third of men without a bachelor’s degree (34%), for example, say a major reason they didn’t complete college is that they just didn’t want to. Only one-in-four women say the same.

Most Democrats in the U.S. see voting as a fundamental right, while most Republicans view it as a privilege that comes with responsibilities, according to a July survey.
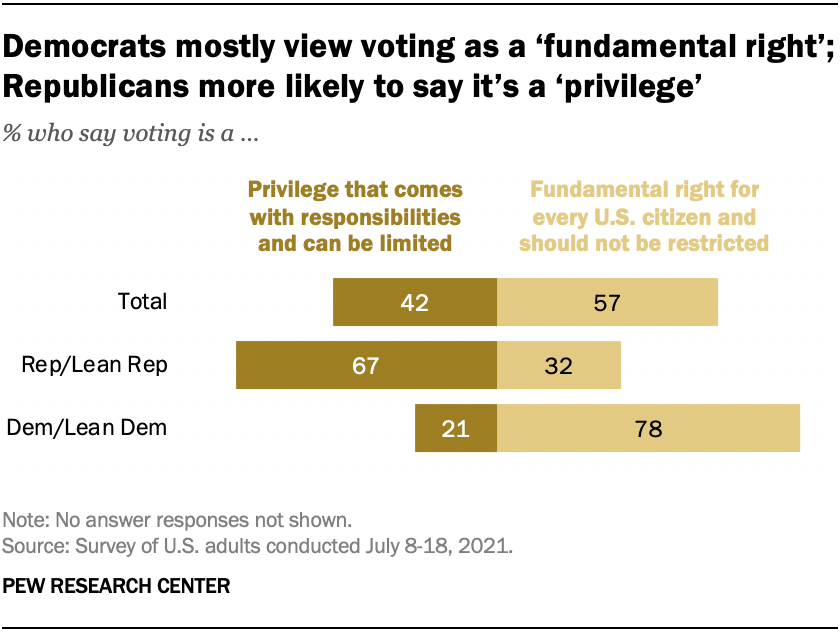
The vast majority of Democrats (78%) say voting is a “fundamental right for every adult U.S. citizen and should not be restricted in any way.” Two-thirds of Republicans say voting is “a privilege that comes with responsibilities and can be limited if adult U.S. citizens don’t meet some requirements.”
Overall, a majority of Americans (57%) say voting is a fundamental right that should not be restricted while 42% express the view that voting is a privilege that comes with responsibilities.
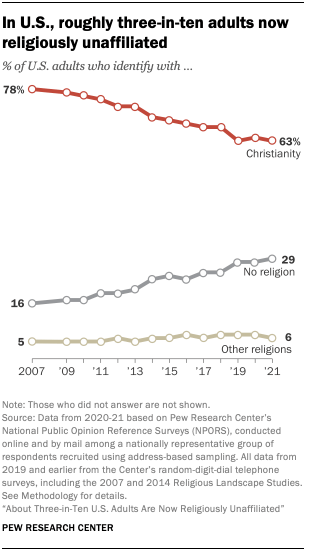
About three-in-ten Americans are religiously unaffiliated, a 10 percentage point rise from a decade ago, according to a survey conducted between May and August. Currently, 29% of U.S. adults are religious “nones” – those who describe themselves as atheists, agnostics or “nothing in particular.” By comparison, 16% described themselves this way when the Center first asked the question in 2007.
Christians continue to make up a majority of the U.S. population (63%), but their share is 12 points lower in 2021 than it was in 2011. Christians now outnumber religious “nones” by a ratio of a little more than two-to-one. In 2007, when the Center began asking its current question about religious identity, Christians outnumbered “nones” by almost five-to-one (78% vs. 16%).
Democrats and Republicans were deeply divided over former President Donald Trump’s role in the events of Jan. 6, according to a March survey.
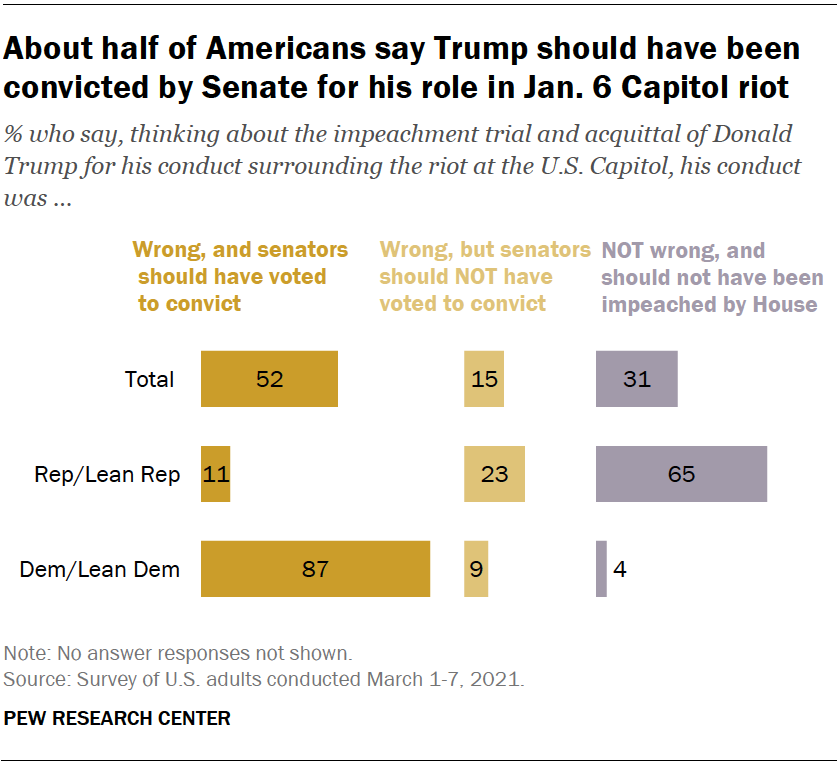
The vast majority of Democrats (87%) said Trump’s conduct surrounding the riot at the U.S. Capitol was wrong and that senators should have voted to convict him during his impeachment trial, while just 11% of Republicans said the same. Around two-thirds of Republicans (65%) said Trump’s conduct was not wrong and that he should not have been impeached by the U.S. House of Representatives; just 4% of Democrats said the same.
Overall, about half of Americans (52%) said Trump’s conduct was wrong and that senators should have voted to convict him, while 31% said his conduct was not wrong and that he should not have been impeached by the U.S. House. Some Americans (15%) said Trump’s conduct was wrong but that senators should not have voted to convict him.
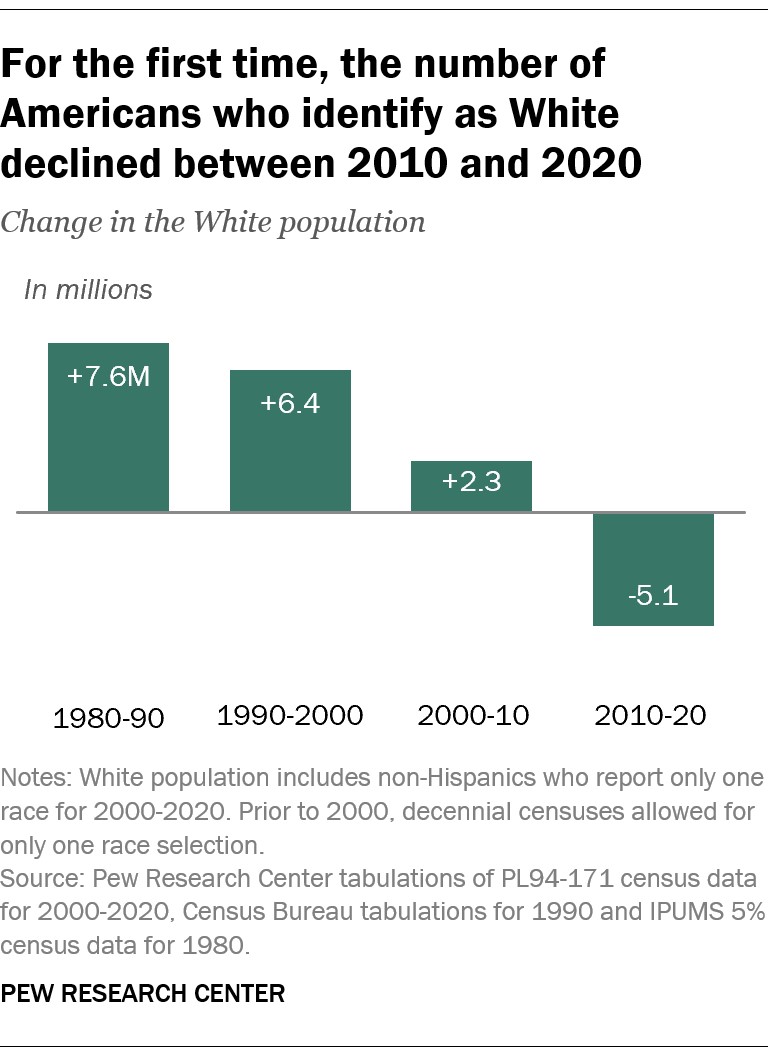
For the first time, the number of Americans who identify as non-Hispanic White declined between 2010 and 2020, according to the Center’s analysis of U.S. Census Bureau data. The White population of the United States declined by about 5.1 million people during that timespan.
In a related Pew Research Center survey in July, about six-in-ten U.S. adults (61%) said the decline in the White share of the U.S. population is neither good nor bad for society. About two-in-ten (22%) said it is bad, including 9% who said it is very bad. Slightly fewer (15%) said it is good, including 7% who said it is very good.
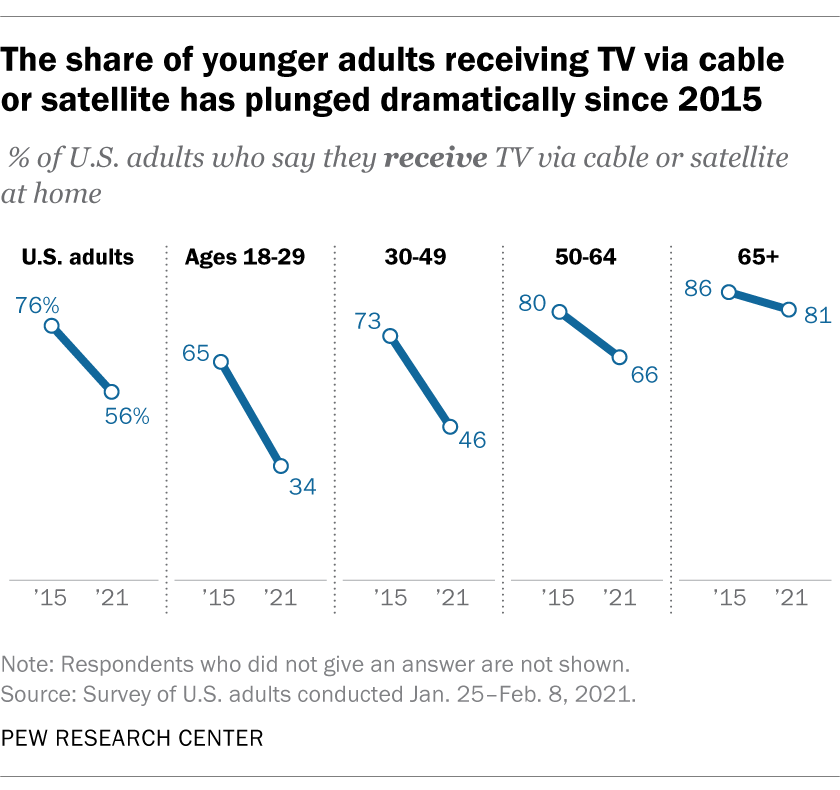
Only 34% of U.S. adults under the age of 30 now get TV through cable or satellite, down from 65% in 2015, according to a survey fielded in January and February. There were declines in other age groups, too, with decreases of 27 percentage points among those ages 30 to 49 and 14 points among those 50 to 64.
Adults under 30 who are nonsubscribers are also much more likely than older nonsubscribers to have never received TV at home via cable or satellite – and to say they don’t currently subscribe because they can find the content they want online instead.
Two-thirds of U.S. adults say extreme weather events across the country have been occurring more often than in the past, a September survey found. Far fewer Americans say they’re happening about as often (28%), and only 4% say they are happening less often.
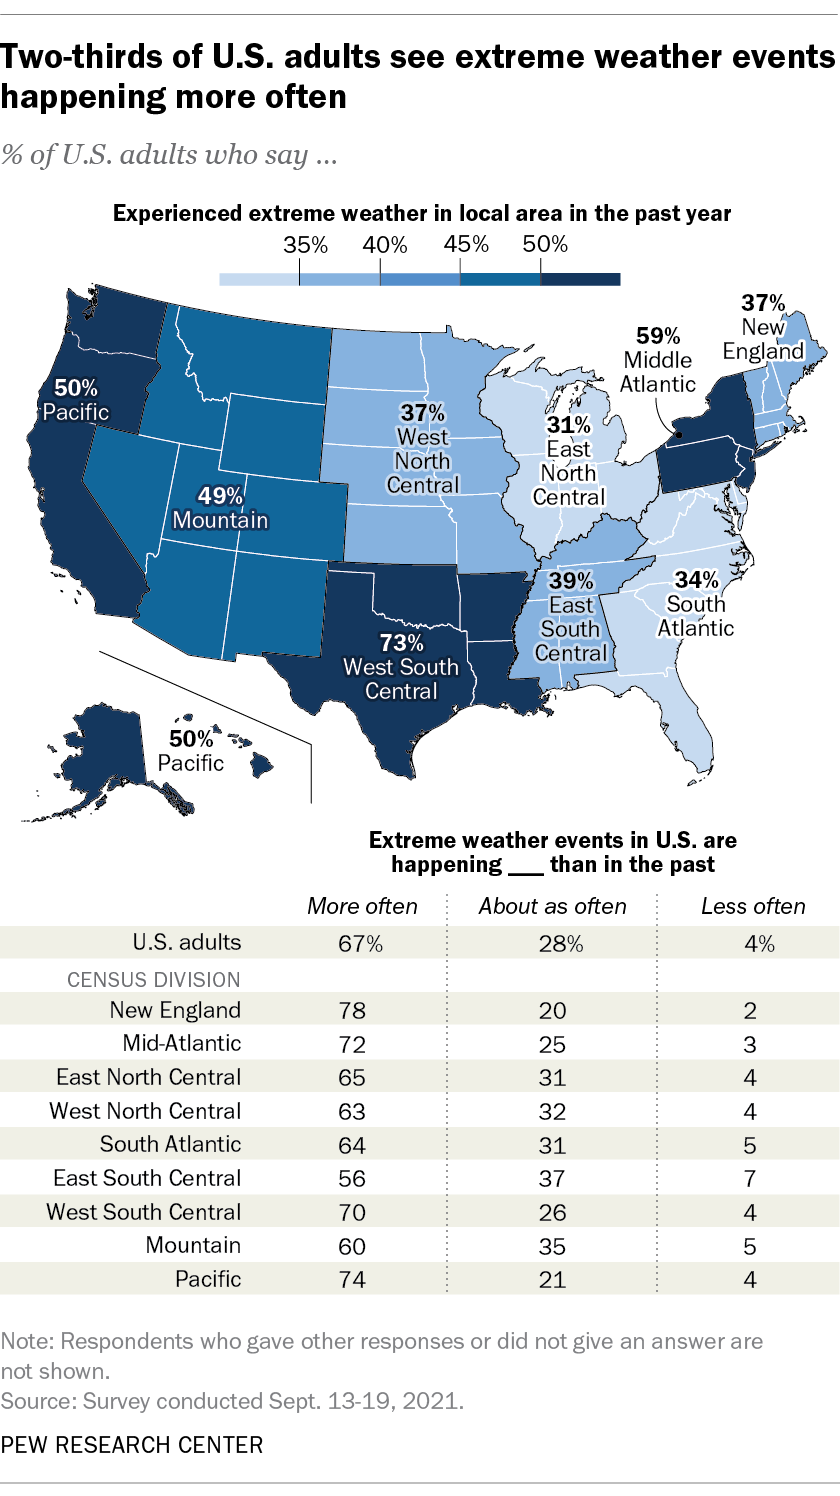
Nearly half of Americans (46%) also say the area where they live has had an extreme weather event over the past 12 months, according to the same survey.
Nearly three-quarters of U.S. adults (73%) in the West South Central census division, which includes Texas, Louisiana, Arkansas and Oklahoma, say they’ve experienced extreme weather within the past year. A majority of adults (59%) say the same in the Mid-Atlantic region, which includes Pennsylvania, New York and New Jersey. By contrast, far fewer say they’ve experienced extreme weather in other regions over the past year.
In most census regional divisions, Democrats are more likely than Republicans to report experiencing extreme weather within the past year. Overall, 51% of Democrats say the area where they live has experienced this, compared with 39% of Republicans.
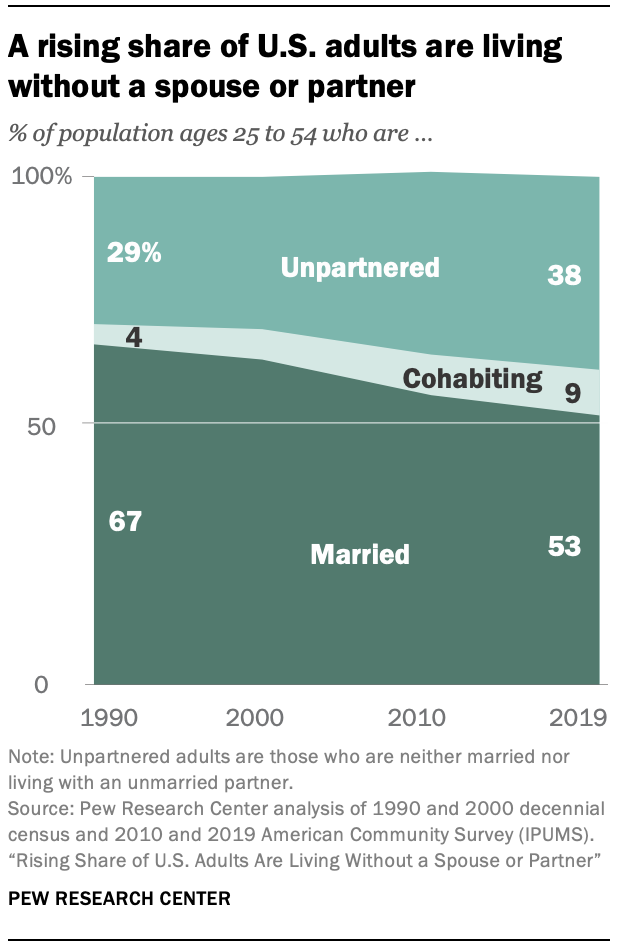
A growing share of U.S. adults are neither married nor living with a partner, according to an October study. In 2019, roughly four-in-ten adults ages 25 to 54 (38%) were unpartnered – that is, neither married nor living with a partner, according to a Pew Research Center analysis of Census Bureau data for that year (the most recent available). This share was up sharply from 29% in 1990. Men were more likely to be unpartnered than women.
All of the growth in the unpartnered population since 1990 has come from a rise in the number who have never been married, although the unpartnered population does include some adults who were previously married (those who are separated, divorced or widowed).
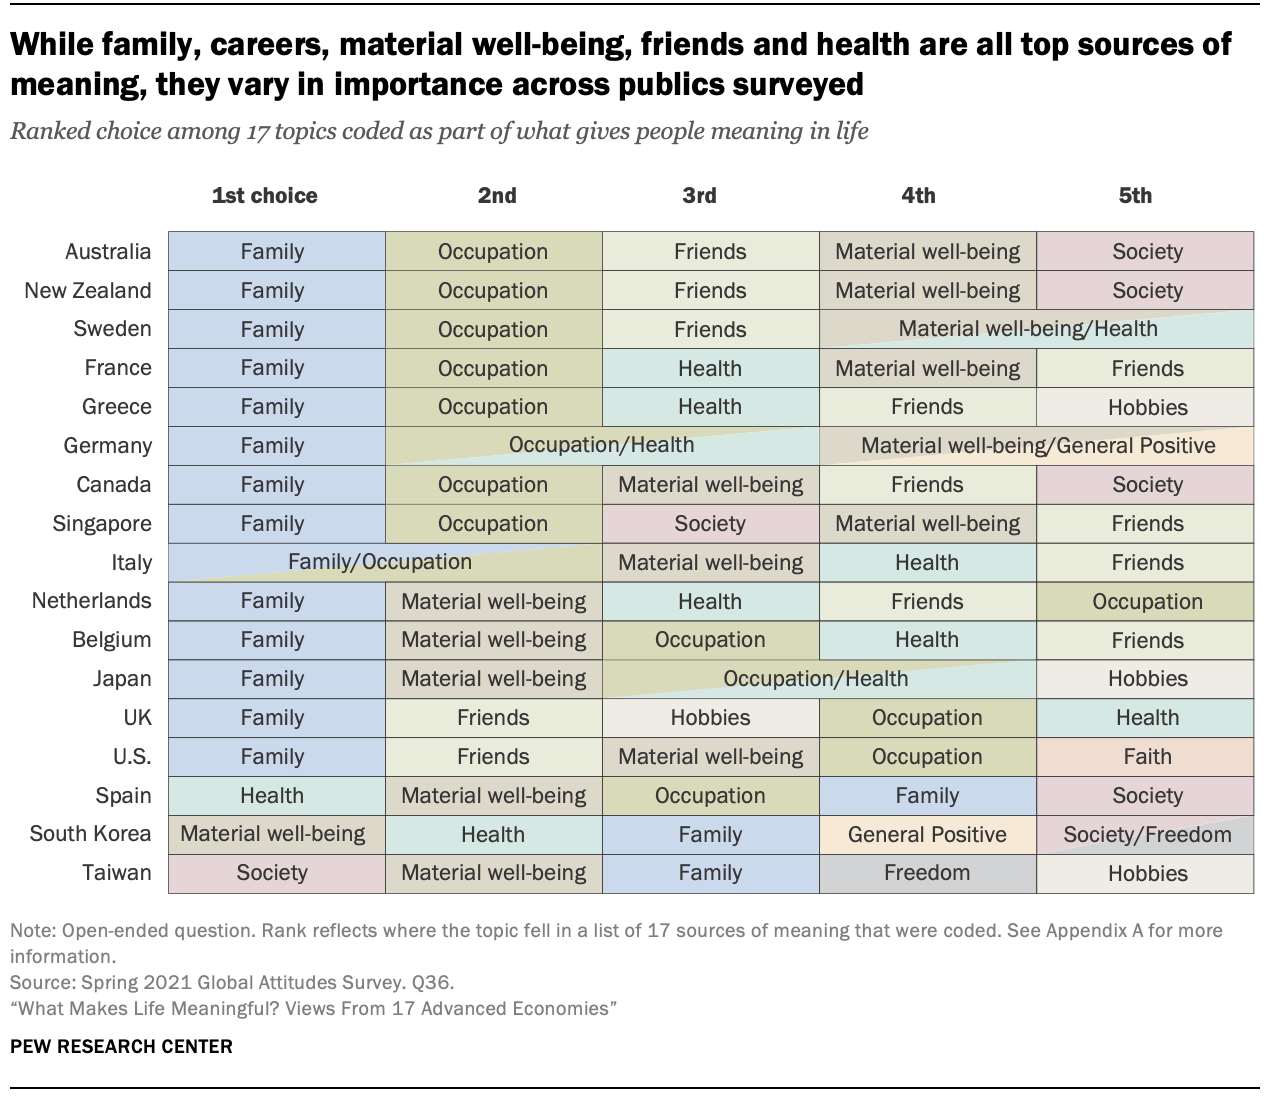
Around the world, more people mention their family as a source of meaning in their lives than any other factor, according to an open-ended survey question the Center posed to people in 17 advanced economies in the spring.
In 14 of the 17 nations surveyed, more people mentioned their family as a source of meaning than anything else. Respondents highlighted their relationships with parents, siblings, children and grandchildren; quality time spent with their relatives; and the pride they get from family members’ accomplishments. Many also expressed the desire to live a life that leaves an improved world for their offspring.