

The nationwide moratorium on evictions – put in place nearly 11 months ago by the Centers for Disease Control and Prevention as an emergency measure – expired this past weekend, although President Joe Biden has proposed extending it. The end of the moratorium, which was intended to protect tenants who couldn’t make their rent payments because of the COVID-19 pandemic, has alarmed tenant advocates, housing experts and others who fear that potentially millions of renters could be put out of their homes.
Renters headed about 36% of the nation’s 122.8 million households in 2019, the last year for which the Census Bureau has reliable estimates. Because certain demographics – young people, racial and ethnic minorities, and those with lower incomes – are more likely to rent, those groups likely will be disproportionately affected when evictions resume.
Pew Research Center consulted several data sources for this analysis of renters and landlords in the United States. The U.S. Census Bureau’s American Community Survey provided the demographic characteristics of renters and homeowners (technically, households in renter-occupied and owner-occupied housing units), as well as data on rent paid as a percentage of household income. The Federal Reserve’s Survey of Consumer Finances provided additional information on renters, particularly on their income and wealth.
A separate Census product, the triennial Rental Housing Finance Survey (RHFS), provided data on ownership and management of rental properties, as well as overall numbers and size ranges. (The data is updated as of 2018; a new RHFS is being conducted this year.) For purposes of analysis, we combined several forms of business organization (limited liability companies, limited and general partnerships, real estate investment trusts and corporations) into a broad category of “for-profit businesses.”
The Internal Revenue Service’s Tax Statistics program was an additional source for data on individual owners of rental property and their finances. Individual investors typically report rental income and losses on Schedule E of Form 1040; we examined aggregated Schedule E filings from 2003 to 2018, the most recent year available.
Race and ethnicity categories reflect U.S. Census Bureau terminology. In this analysis, Black or African American adults and Asian Americans do not include Hispanic/Latino adults, who may be of any race.
But setting policies to help renters in need without hurting landlords is complicated. Landlords aren’t a homogenous group of faceless corporations. In fact, fewer than one-fifth of rental properties are owned by for-profit businesses of any kind. Most rental properties – about seven-in-ten – are owned by individuals, who typically own just one or two properties, according to 2018 census data. And landlords have complained about being unable to meet their obligations, such as mortgage payments, property taxes and repair bills, because of a falloff in rent payments.
One big disparity among renters is race and ethnicity. Nationwide, about 58% of households headed by Black or African American adults rent their homes, as do nearly 52% of Hispanic- or Latino-led households, according to Pew Research Center’s analysis of census data. By contrast, roughly a quarter of households led by non-Hispanic White adults (27.9%) are rentals, as are just under 40% of Asian-led households.
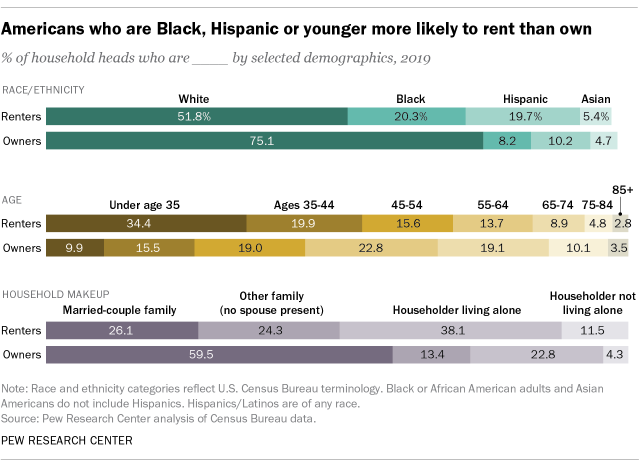
White, non-Hispanic householders account for three-quarters of all owner-occupied housing units in the United States, but just over half of all renter-occupied units.
Younger people – those below the age of 35 – are far more likely to rent than are other age groups: About two-thirds (65.9%) of this age group lives in rentals. This compares with, for example, 42% of those ages 35 to 44, and less than a third (31.5%) of 45- to 54-year-olds.
Though renter-occupied households are almost evenly split between families (50.4%) and non-families (49.6%), people living alone account for the biggest single group of renters (38.1%, or nearly four-in-ten). (The Census Bureau defines a “family” as any group of two or more people related by birth, marriage or adoption who live together.)
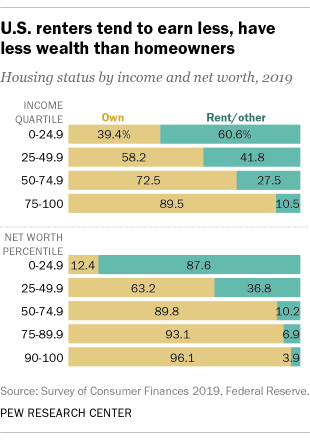
Renters skew to the lower ends of income and wealth distributions, according to data from the Federal Reserve’s 2019 Survey of Consumer Finances. About three-fifths of people in the lowest income quartile (60.6%) rent their homes, as do 87.6% of people with net worths below the 25th percentile. In both cases, as one goes up the income or net worth distribution scale, the share of people who are renters falls: Only 10.5% of people in the top income quartile, for example, are renters.
If those are the renters, then who are the landlords? The Census Bureau counted nearly 20 million rental properties, with 48.2 million individual units, in its 2018 Rental Housing Finance Survey, the most recent one conducted. Individual investors owned nearly 14.3 million of those properties (71.6%), comprising almost 19.9 million units (41.2%). For-profit businesses of various sorts owned 3.7 million properties, or 18.8%, but their holdings totaled 21.7 million units, or 45% of the total. Entities such as housing cooperative organizations and nonprofits owned smaller shares of the total.
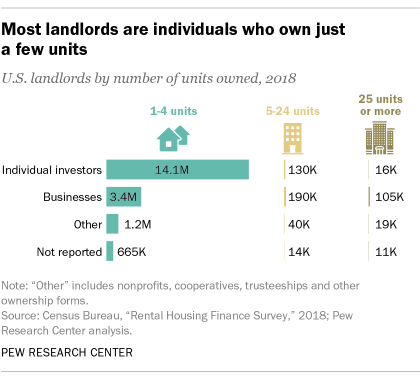
Businesses own larger shares of units because individuals, while far more numerous, tend to own one or two properties at most, while businesses’ holdings are larger. In fact, 72.5% of single-unit rental properties are owned by individuals, while 69.5% of properties with 25 or more units are owned by for-profit businesses.
Most rental properties are owned by individuals, but only a small share of individuals own rental property, according to IRS income-tax data. In 2018, 6.7% of individual tax filers (about 10.3 million) reported owning rental properties. Those filers reported owning 1.72 properties on average.
There was a notable increase in both the number and share of individual filers reporting rental property during and after the 2007-08 mortgage crisis. In 2006, 8.3 million tax returns (6%) reported ownership of rental property. By 2014, that number had risen to nearly 10.7 million (7.2%). One researcher at the Department of Housing and Urban Development (HUD) has suggested that those figures reflect a surge of individuals buying foreclosed homes on the cheap and renting them out.
Tax data on businesses that own rental property is harder to come by. However, that same HUD researcher has estimated that there are fewer than 1 million “business entity” landlords, adding that they “likely own an average of more than 20 units, with many managing hundreds of units.”
Individual landlords received $353.7 billion in rental income in 2018, which sounds like (and is) a lot of money. But as any businessperson knows, top-line revenue doesn’t necessarily lead to bottom-line profit. Indeed, only about half of individual landlords reported net income in 2018, with the rest losing money on their properties. Such losses can, under certain conditions, be used to offset other taxable income.
Regardless of whether the landlord is making money, rent makes up a big chunk of many tenants’ expenses. Of the nearly 44.1 million renter households in 2019, more than 45% paid rent equal to 30% or more of their gross household income (30% being a common rule of thumb for how much of a person’s gross income should be spent on housing). That’s actually down from 2013, when nearly half (49.7%) of renter households were paying 30% or more in rent.
