
Six-in-ten U.S. adults favor the death penalty for people convicted of murder, according to an April Pew Research Center survey that was conducted online using the Center’s American Trends Panel. The share of adults who support capital punishment for convicted murderers has been relatively stable in the Center’s online surveys over the past few years.
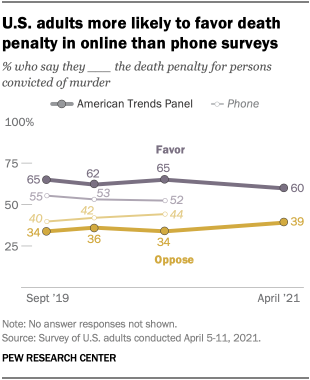
Opinions about the death penalty have also remained stable in the Center’s telephone surveys during this period. But while there has been relative continuity in Americans’ views across both survey modes, the public consistently expresses more support for the death penalty online than on the phone – a finding that has important consequences for understanding trends on the issue.
As the Center has previously noted, people sometimes – though not always – respond differently to similar questions on the same topics in online and telephone polls. There are a variety of reasons why that might be the case, including the fact that survey respondents’ answers might be influenced by the presence of a live phone interviewer (as opposed to online polls, which are self-administered).
Pew Research Center conducted this study to better understand Americans’ views of the death penalty and to examine the effects of survey mode on attitudes about the death penalty. For this analysis, we most recently surveyed 5,109 U.S. adults in April 2021. Everyone who took part in the April survey is a member of the Center’s American Trends Panel (ATP), an online survey panel that is recruited through national, random sampling of residential addresses. This way nearly all U.S. adults have a chance of selection. The survey is weighted to be representative of the U.S. adult population by gender, race, ethnicity, partisan affiliation, education and other categories. Read more about the ATP’s methodology.
This study also uses data from three pairs of contemporaneous online and phone surveys. In September 2019, we surveyed 9,895 U.S. adults online and 2,004 U.S. adults by phone. In January 2020, we surveyed 12,638 U.S. adults online and 1,504 U.S. adults by phone. And in July and August 2020, we surveyed 11,001 U.S. adults online and 1,750 U.S. adults by phone. All who took part in these online surveys were members of the American Trends Panel at the time they were surveyed. Respondents to the phone surveys were randomly selected using a combination of landline and cellphone random-digit-dial samples, and interviews were conducted in both English and Spanish under the direction of Abt Associates.
Here are the questions used in the April 2021 survey, along with responses, and its methodology. Additional information about the methodology used for each of the earlier surveys is available here:
To study possible “mode effects” in the context of Americans’ views about capital punishment, the Center in September 2019 began including questions about the death penalty on surveys using the online American Trends Panel. We asked this question in online and telephone surveys fielded during the same periods three times: in September 2019, January 2020 and August 2020. By asking the question both ways in contemporaneous surveys, we could not only assess differences by survey mode, but also determine whether attitudes changed over the period in question.
On both the ATP and telephone surveys, views remained relatively constant over this period. However, there were sizable – and largely consistent – differences between the two modes.
In a survey conducted on the American Trends Panel in August 2020, 65% of adults said they favored the death penalty for people convicted of murder, while 34% were opposed. In a telephone survey over a nearly identical period, 52% of adults favored the death penalty and 44% opposed it. On the two prior occasions when the Center asked this question in both survey formats, support for the death penalty was 9 and 10 percentage points higher, respectively, in the online surveys than in the phone polls. (There were slight differences in the wording of online and telephone surveys; see topline for question wording.)
The experience of taking surveys is different when respondents are speaking with a live interviewer, as opposed to answering a question online. In addition, survey questions that ask about sensitive or controversial topics – and views of the death penalty may be one such topic – may be more likely to elicit different responses across modes, perhaps attributable to social desirability bias. When mode differences stem from social desirability, data collected via self-administered modes (e.g., online) is typically more accurate than data collected by an interviewer (e.g., by phone), all else being equal.
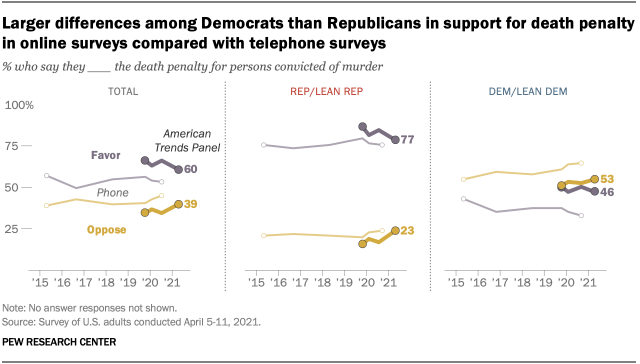
When it comes to views of the death penalty, mode differences are wider among Democrats than Republicans. In the August 2020 web survey, 83% of Republicans and independents who lean toward the Republican Party said they favored the death penalty, compared with 74% in the phone survey. Among Democrats and Democratic leaners, 49% said they favored the death penalty online, versus 32% on the phone. This pattern was evident all three times the Center asked the question in both modes.
Because this mode effect is more pronounced among Democrats than Republicans – and because Republicans are generally more supportive of the death penalty than Democrats – there are somewhat smaller partisan differences in online surveys than in phone surveys. In the August 2020 online survey, for example, Republicans were 34 percentage points more likely than Democrats to favor the death penalty. In the phone survey conducted the same month, the partisan gap was 42 points.
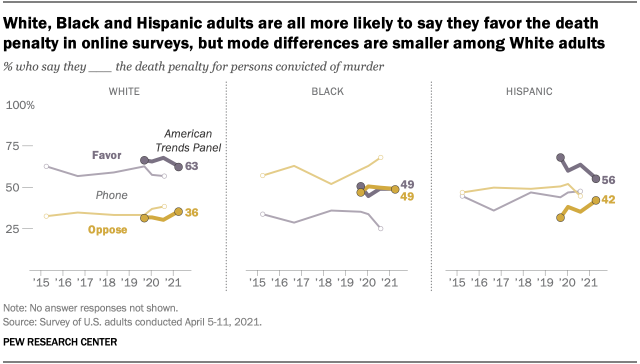
The pattern of more support for the death penalty in online surveys holds across racial and ethnic groups as well. In the three pairs of surveys, White adults were on average 8 percentage points more likely to say they favored the death penalty online than on the phone. The gaps were even larger among Black and Hispanic adults: 17 points and 18 points, respectively, on average.
Both college graduates and those without college degrees are more likely to favor the death penalty in online surveys than on the phone. Across the three pairs of surveys in this analysis, college graduates were 8 points more likely to say they favored the death penalty online than by phone, on average. Adults without college degrees were an average of 11 points more likely to support capital punishment online than by phone.
Support for the death penalty has been relatively stable in recent years but remains lower than in the mid-1990s
Because of the substantial mode differences in support for the death penalty, online survey results on this question should not directly be compared to phone estimates. However, telephone surveys provide a basis for examining long-term changes in the public’s attitudes toward the death penalty.
These surveys, conducted with a live interviewer asking respondents for their opinions, have shown a steady decline in support for the death penalty in the United States since the mid-1990s. Between 1996 and 2020, the share of Americans saying they favor the death penalty for people convicted of murder declined 26 percentage points (from 78% to 52%). Opposition to the death penalty more than doubled during this period, from 18% to 44%.
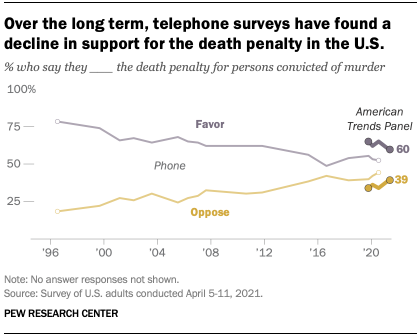
Surveys conducted on both the phone and online over the past few years have found largely stable attitudes, with a modest decrease online in support for the death penalty since 2019.
Other survey research organizations have observed similar changes in public opinion about the death penalty over the past 25 years. For example, Gallup surveys conducted by telephone find a similar long-term decline in support, with little change in attitudes in recent years.
Note: Here are the questions used in the April 2021 survey, along with responses, and its methodology.

