
In the United States, the white share of the population is declining as Hispanic, Asian and black populations grow. But the shift to a more diverse nation is happening more quickly in some places than in others.
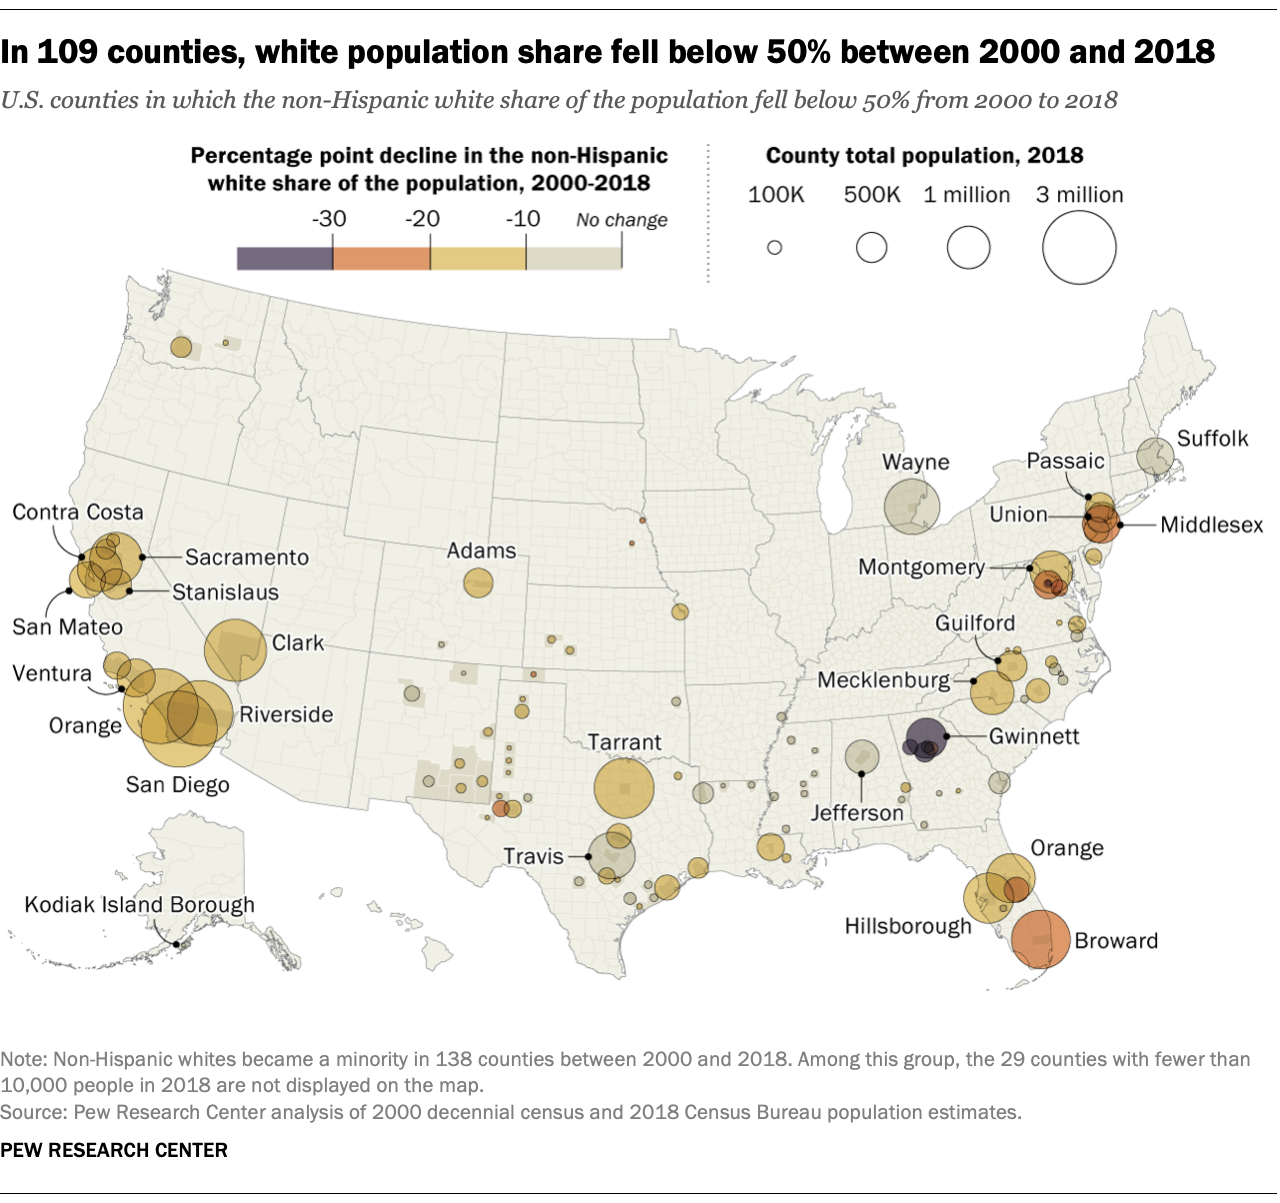
From 2000 to 2018, 109 counties in 22 states, from California to Kansas to North Carolina, went from majority white to majority nonwhite – that is, counties where non-Hispanic whites are no longer the majority, according to a Pew Research Center analysis of Census Bureau data. (Our analysis includes only counties with a minimum population of 10,000 in 2018. These counties represent 77% of the nation’s 3,142 counties and include 99% of the U.S. population.)
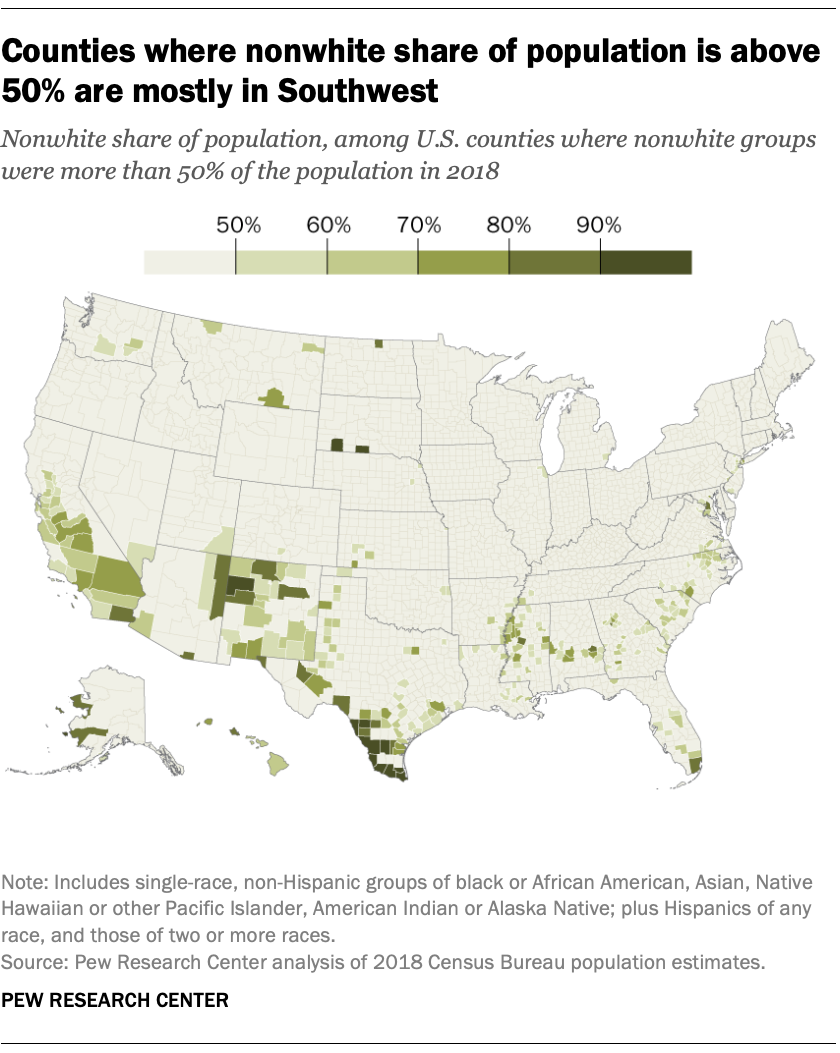
Overall, 293 U.S. counties were majority nonwhite in 2018. Most of these counties are concentrated in California, the South and on the East Coast, with few in the country’s middle section. In addition, several majority white counties with large populations may flip in coming years. Fairfax County, Virginia (total of 1.2 million), Pima County, Arizona (1 million), Milwaukee County, Wisconsin (948,000) and Cobb County, Georgia (757,000) all had populations that were less than 52% white.
In 21 of the 25 biggest U.S. counties by population, nonwhite groups together make up more than half of residents. Eight of these counties were majority white in 2000 but are no longer: San Diego, Orange, Riverside and Sacramento (all in California), plus Clark (Nevada), Broward (Florida), Tarrant (Texas) and Wayne (Michigan). Hispanics were the largest nonwhite population in all of these eight counties except Wayne – which contains Detroit – where the black population was the largest nonwhite group. (In Broward County, Hispanic and black residents made up similar shares of the population at 30% and 28%, respectively.)
As the nation’s racial and ethnic diversity grows, whites remain the single largest racial or ethnic group in the U.S. when looking at the country as a whole, accounting for 60% of all Americans. The four largest U.S. counties that had majority white populations in 2018 were Maricopa (Arizona), King (Washington), Middlesex (Massachusetts) and Palm Beach (Florida).

Sign up for our weekly newsletter
Our latest data, delivered Saturdays
Another way to highlight the nation’s changing demographics is to look at how many counties shifted the opposite way. From 2000 to 2018, just two counties went from minority white to majority white: Calhoun County in South Carolina and West Feliciana Parish in Louisiana, each with relatively small populations of about 15,000.
Among the 109 counties that between 2000 and 2018 shifted from majority white to majority nonwhite, 26 were at least 60% white in 2000. Counties in Georgia stand out for having five of the 10 biggest percentage point swings in their white population share. (These 10 counties also had the largest percentage point drop among all U.S. counties on this measure.)
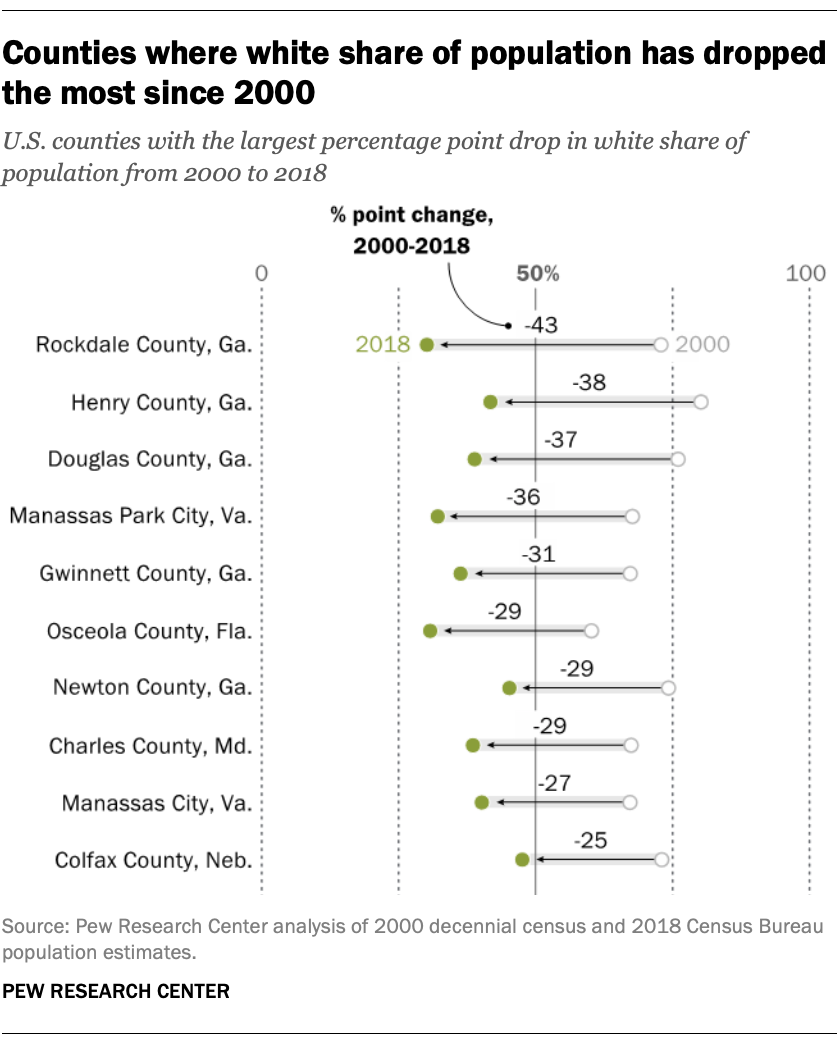
Gwinnett County, near Atlanta, was largest in overall population (928,000) among these top 10. Its population dropped from 67% white in 2000 to 36% in 2018. Rockdale, home to 91,000 and also near Atlanta, had the biggest percentage point swing of the top 10 counties on this measure, falling from 73% white to 30% during the same time period.
This trend stems from a flat or declining number of white Americans in each of these five Georgia counties (Henry, Douglas and Newton are the other three), combined with a large and growing black population and a smaller Hispanic population that is also increasing in number. (In recent decades, many black Americans have moved to the Atlanta area from Northern states as part of a return migration to the South.)
The future racial and ethnic composition of the U.S. has been a subject of debate, due in part to the growing number of Americans with varied backgrounds – and how these Americans identify themselves. The number of multiracial Americans is rising, for example, and in a recent Pew Research Center survey, about half of U.S. Hispanic adults identified their race as white.
Correction: The chart “Counties where nonwhite share of population is above 50% are mostly in Southwest” has been updated to correct the color of seven counties.
Note: This is an update to a post originally published April 8, 2015.
For a closer look at counties that recently flipped, see the sortable table below:
U.S. counties where white share of population has dropped below 50% since 2000
| State | County | Total population, 2000 | Total population, 2018 | % white, non-Hispanic, 2000 | % white, non-Hispanic, 2018 | Percentage point change, 2000-2018 |
| AL | Barbour | 29,042 | 24,881 | 51% | 46% | -5% |
| AL | Jefferson | 662,041 | 659,300 | 57% | 50% | -8% |
| AL | Russell | 49,854 | 57,781 | 56% | 46% | -10% |
| AK | Kodiak Island | 13,916 | 13,345 | 58% | 49% | -9% |
| AR | Crittenden | 50,855 | 48,342 | 51% | 41% | -9% |
| CA | Contra Costa | 948,865 | 1,150,215 | 59% | 43% | -15% |
| CA | Orange | 2,846,282 | 3,185,968 | 52% | 40% | -12% |
| CA | Riverside | 1,545,320 | 2,450,758 | 52% | 35% | -17% |
| CA | Sacramento | 1,223,578 | 1,540,975 | 59% | 44% | -14% |
| CA | San Diego | 2,813,839 | 3,343,364 | 56% | 45% | -10% |
| CA | San Mateo | 707,099 | 769,545 | 51% | 39% | -12% |
| CA | Santa Barbara | 399,293 | 446,527 | 57% | 44% | -13% |
| CA | Stanislaus | 446,850 | 549,815 | 58% | 41% | -17% |
| CA | Sutter | 78,947 | 96,807 | 61% | 45% | -15% |
| CA | Ventura | 753,230 | 850,967 | 57% | 45% | -12% |
| CA | Yolo | 168,660 | 220,408 | 59% | 46% | -13% |
| CO | Adams | 348,076 | 511,868 | 63% | 50% | -13% |
| CO | Alamosa | 14,965 | 16,683 | 55% | 48% | -6% |
| FL | Broward | 1,622,974 | 1,951,260 | 59% | 36% | -23% |
| FL | Hardee | 26,854 | 27,245 | 55% | 47% | -8% |
| FL | Hillsborough | 998,994 | 1,436,888 | 64% | 48% | -15% |
| FL | Orange | 896,123 | 1,380,645 | 58% | 40% | -18% |
| FL | Osceola | 172,520 | 367,990 | 60% | 31% | -29% |
| GA | Chatham | 232,372 | 289,195 | 54% | 48% | -6% |
| GA | Crisp | 22,020 | 22,601 | 54% | 50% | -4% |
| GA | Decatur | 28,252 | 26,575 | 56% | 50% | -6% |
| GA | Douglas | 92,315 | 145,331 | 76% | 39% | -37% |
| GA | Gwinnett | 588,133 | 927,781 | 67% | 36% | -31% |
| GA | Henry | 119,498 | 230,220 | 80% | 42% | -38% |
| GA | Newton | 61,906 | 109,541 | 74% | 45% | -29% |
| GA | Rockdale | 70,292 | 90,594 | 73% | 30% | -43% |
| GA | Telfair | 11,815 | 15,876 | 59% | 49% | -10% |
| KS | Finney | 40,517 | 36,611 | 52% | 40% | -11% |
| KS | Ford | 32,452 | 33,888 | 57% | 39% | -18% |
| KS | Wyandotte | 157,924 | 165,324 | 52% | 41% | -11% |
| LA | Caddo | 251,129 | 242,922 | 52% | 45% | -8% |
| LA | Claiborne | 16,850 | 15,944 | 52% | 45% | -7% |
| LA | East Baton Rouge | 412,899 | 440,956 | 55% | 44% | -11% |
| LA | Morehouse | 31,037 | 25,398 | 56% | 49% | -7% |
| LA | St. John the Baptist | 43,181 | 43,184 | 51% | 34% | -17% |
| MD | Charles | 120,524 | 161,503 | 67% | 39% | -29% |
| MD | Montgomery | 873,874 | 1,052,567 | 60% | 43% | -17% |
| MA | Suffolk | 691,047 | 807,252 | 53% | 45% | -8% |
| MI | Wayne | 2,061,180 | 1,753,893 | 51% | 49% | -1% |
| MS | Chickasaw | 19,447 | 17,171 | 56% | 49% | -7% |
| MS | Leake | 20,930 | 22,763 | 56% | 47% | -9% |
| MS | Panola | 34,283 | 34,178 | 50% | 47% | -4% |
| MS | Pike | 38,957 | 39,563 | 51% | 43% | -8% |
| MS | Scott | 28,455 | 28,287 | 55% | 49% | -6% |
| MS | Warren | 49,668 | 46,176 | 55% | 47% | -8% |
| MS | Winston | 20,157 | 18,165 | 55% | 50% | -5% |
| NE | Colfax | 10,434 | 10,881 | 73% | 48% | -25% |
| NE | Dakota | 20,265 | 20,083 | 71% | 48% | -23% |
| NV | Clark | 1,375,741 | 2,231,647 | 61% | 42% | -19% |
| NJ | Cumberland | 146,454 | 150,972 | 59% | 46% | -13% |
| NJ | Mercer | 350,773 | 369,811 | 65% | 49% | -16% |
| NJ | Middlesex | 750,275 | 829,685 | 63% | 42% | -20% |
| NJ | Passaic | 490,285 | 503,310 | 53% | 41% | -12% |
| NJ | Union | 522,507 | 558,067 | 55% | 40% | -15% |
| NM | Chaves | 61,373 | 64,689 | 52% | 39% | -14% |
| NM | Colfax | 14,191 | 12,110 | 50% | 47% | -4% |
| NM | Curry | 45,050 | 49,437 | 59% | 47% | -12% |
| NM | Eddy | 51,633 | 57,900 | 58% | 46% | -12% |
| NM | Lea | 55,528 | 69,611 | 54% | 35% | -19% |
| NM | Otero | 62,195 | 66,781 | 57% | 48% | -8% |
| NM | Sandoval | 90,546 | 145,179 | 51% | 43% | -8% |
| NC | Cumberland | 302,978 | 332,330 | 53% | 43% | -10% |
| NC | Greene | 18,957 | 21,012 | 50% | 47% | -3% |
| NC | Guilford | 420,848 | 533,670 | 63% | 50% | -13% |
| NC | Lenoir | 59,636 | 55,976 | 56% | 49% | -6% |
| NC | Mecklenburg | 695,348 | 1,093,901 | 61% | 46% | -15% |
| NC | Nash | 87,378 | 94,016 | 61% | 49% | -12% |
| NC | Scotland | 35,952 | 34,810 | 51% | 43% | -8% |
| NC | Wilson | 73,810 | 81,455 | 54% | 47% | -7% |
| OK | Cherokee | 42,475 | 48,675 | 55% | 47% | -8% |
| OK | Texas | 20,098 | 20,455 | 67% | 44% | -23% |
| TX | Andrews | 13,002 | 18,128 | 57% | 40% | -17% |
| TX | Bell | 238,000 | 355,642 | 58% | 45% | -13% |
| TX | Brazoria | 241,805 | 370,200 | 66% | 46% | -19% |
| TX | Calhoun | 20,645 | 21,561 | 52% | 42% | -11% |
| TX | Ector | 121,124 | 162,124 | 51% | 32% | -20% |
| TX | Gonzales | 18,601 | 20,826 | 51% | 41% | -10% |
| TX | Guadalupe | 88,856 | 163,694 | 60% | 50% | -10% |
| TX | Hockley | 22,719 | 22,980 | 58% | 46% | -12% |
| TX | Howard | 33,630 | 36,459 | 57% | 48% | -9% |
| TX | Jefferson | 251,968 | 255,001 | 52% | 40% | -12% |
| TX | Lamb | 14,713 | 13,158 | 51% | 39% | -12% |
| TX | Matagorda | 37,919 | 36,552 | 53% | 44% | -9% |
| TX | Medina | 39,318 | 50,921 | 51% | 43% | -8% |
| TX | Midland | 116,034 | 172,578 | 62% | 45% | -17% |
| TX | Moore | 20,123 | 21,485 | 50% | 31% | -19% |
| TX | Potter | 113,655 | 119,648 | 58% | 43% | -14% |
| TX | Tarrant | 1,449,290 | 2,084,931 | 62% | 46% | -16% |
| TX | Terry | 12,757 | 12,287 | 50% | 39% | -12% |
| TX | Titus | 28,118 | 33,033 | 60% | 44% | -15% |
| TX | Travis | 811,776 | 1,248,743 | 57% | 49% | -8% |
| TX | Victoria | 84,077 | 92,035 | 53% | 44% | -9% |
| TX | Ward | 10,909 | 11,720 | 52% | 39% | -13% |
| TX | Wharton | 41,191 | 41,619 | 53% | 44% | -9% |
| VA | Prince William | 281,317 | 468,011 | 65% | 42% | -23% |
| VA | Danville city | 48,312 | 40,693 | 53% | 42% | -11% |
| VA | Hopewell city | 22,278 | 22,596 | 61% | 45% | -16% |
| VA | Manassas city | 34,692 | 41,641 | 67% | 40% | -27% |
| VA | Manassas Park city | 10,226 | 17,307 | 68% | 32% | -36% |
| VA | Martinsville city | 15,418 | 12,902 | 54% | 44% | -10% |
| VA | Newport News city | 180,272 | 178,626 | 52% | 43% | -10% |
| VA | Suffolk city | 63,699 | 91,185 | 53% | 49% | -4% |
| WA | Adams | 16,426 | 19,759 | 51% | 33% | -18% |
| WA | Yakima | 222,578 | 251,446 | 57% | 43% | -14% |
