
Note: For an updated and revised version of this post from August 2025, read “Q&A: How Pew Research Center estimates the number of unauthorized immigrants living in the U.S.” For the Center’s 2025 estimates of unauthorized immigrants, read “U.S. Unauthorized Immigrant Population Reached a Record 14 Million in 2023.”
The way Pew Research Center calculates the estimated number of unauthorized immigrants in the United States is the product of decades of work by Jeffrey S. Passel, senior demographer, along with former colleagues at the U.S. Census Bureau and the Urban Institute. Passel has written numerous studies on the demography of immigration and on immigration issues. Following are his answers to some common questions about the research techniques used to derive the unauthorized immigrant population estimate.
What were the challenges in developing the estimate of unauthorized immigrants?

I’ve been working on this problem since roughly 1979. So, it’s not a new one. When we started, there really wasn’t very good information at all. The numbers available were speculative, with a very broad range. People were talking about maybe 6 million, maybe 12 million – all of which turned out to be too high. I was working at the Census Bureau and it was important to get some sound, empirical information on this population. We needed the numbers for a lot of different purposes at the time. The challenge was finding data sources that included unauthorized immigrants. We weren’t sure they were showing up in the census and our surveys, but as we looked into the issue, it became apparent that our standard data sources did include unauthorized immigrants. That discovery led us to a variation of the methodology we’re still using.
Walk us through the steps of how you make the estimate now.
The methods have been refined and tinkered with as we’ve learned more and as we’ve gotten more and better data. But the basic method is the same: We make an estimate of how many immigrants are in the country legally. A census or a national survey gives us a measure of how many immigrants (lawful and unauthorized combined) are living in the U.S. Then, we subtract the lawful immigrants from the total.
Basically, then, our estimate of unauthorized immigrants is the total number of immigrants living in the country minus the number of immigrants living here as lawful residents. In concept, it’s a very simple relationship. There’s a lot that goes into producing the final estimate, but the basic estimate is just this difference.
The data we have on lawful immigrants are a pretty solid set of numbers. Each year, the government admits two groups of immigrants who are allowed to live permanently in the U.S. The larger group is those admitted as lawful permanent residents, or people with so-called green cards. We get a count of those people and we know what countries they’re from, how old they are and a lot of other demographic characteristics. Those numbers now come from the Department of Homeland Security; before that, they came from the old INS, the Immigration and Naturalization Service. The other group of people admitted is refugees, and we get these counts from the Office of Refugee Resettlement, which is part of the Department of Health and Human Services.
What we do with those counts is develop a population estimate for lawful immigrants with standard demographic techniques that account for deaths, departures from the country and new arrivals each year. We’ve built up that estimate with data going back to 1980.
Talk about the next step in analyzing the unauthorized immigrant population once you’ve done that initial calculation you described.
The initial calculation that we do estimates how many unauthorized immigrants are in the U.S. survey, or census, not the total number in the country. We know that surveys always miss some people, but immigrants (and especially unauthorized immigrants) are harder to count. So, the final step in producing our estimates is to make an adjustment for the unauthorized immigrants who are missed by the survey.
There have been several studies done by demographers looking at coverage of censuses and surveys. We draw on data from Census Bureau studies of the undercount. We use information from a couple of surveys focused on Mexicans in the U.S. that asked whether they participated in the census or not. And perhaps our most useful set of data comes from surveys and censuses done in Mexico. Mexicans are by far the largest group, now accounting for almost half of the unauthorized immigrants in the U.S., so we feel that if we can get a good handle on how well they’re counted, we can generalize to other groups of people. Mexico has its own censuses; they have a number of large-scale surveys of Mexicans in their country; and they have good historical data. Essentially, almost all of the Mexicans in the world are either in Mexico or the U.S., so by looking at the number in the two countries combined, we can make some inferences on how good the data are in the U.S. and place some limits on how many Mexican immigrants might be missed in U.S. data sources.
We end up making upward adjustments to our initial estimates for undercount that usually fall in the range of 5% to 15% overall, but are substantially greater for some groups, such as young adult men and recently arrived immigrants.
Where does the information on the total number of immigrants living in the country come from?
The estimates of the total number of immigrants in the U.S. come from two Census Bureau surveys: the American Community Survey (ACS) and the Current Population Survey (CPS). Both ask people where they were born, whether they’re U.S. citizens and so forth – but not whether they’re here legally. From those surveys, we get a number for what’s called the “foreign-born” population. Previous estimates we published used the CPS for most years, but now we’re using the ACS data for 2005 and later years and the CPS data for before 2005.
Why the change?
The CPS (which, by the way, provides the data used to calculate the monthly unemployment rate) is a large survey by the standards of the survey world – normally about 55,000 households a month. We use the CPS from March of each year, when they increase the sample size to about 80,000 households and expand the questionnaire to include questions that get at income, poverty and health insurance coverage. But when you restrict it to just immigrants and then look only at some immigrants, it can have pretty sizable margins of error.

So we started using the ACS, which is an even larger survey launched in 2005 to replace the old “long form” from the decennial census. In the ACS, they interview more than 2 million households a year. We get access to a sample that works out to 1% of the entire country, or currently more than 3 million people. Since the ACS is much, much bigger than the CPS, we get much smaller margins of error, so we can have greater confidence in measuring year-to-year changes in the unauthorized immigrant population.
Sometimes we have used data from the CPS to produce preliminary estimates of the unauthorized immigrant population, because they are more current than ACS data. The Census Bureau generally releases data from the March CPS in September of the same year. By contrast, the ACS data we use are usually released in October or November, but for the previous year. Because of this difference in timing, we have, on occasion, released CPS-based estimates that we consider preliminary, in large part because they are potentially less accurate than an ACS-based estimate.
Using the ACS data wasn’t the only change you made, was it?
No, we have also re-weighted some data from prior years. You see, the population numbers you get from a survey are tied to annual population estimates the Census Bureau puts out. What they do is work from the previous census and update the population figures each year; then, every 10 years, they get a new benchmark with the latest census. So, once the 2010 decennial census was available, we had a much better idea of what the population looked like in, for example, 2009 than we had before when the estimates were based on the 2000 census projected forward nine years.
However, Census doesn’t go back and re-estimate the CPS and ACS data from past years when it gets the new decennial benchmarks. So we went back and re-estimated the data for every year from 2001 through 2009, based on both the 2000 census data and the new the 2010 census data. We do that because we think it’s important that our surveys be consistent over time to allow us to talk about year-to-year changes. Without the re-weighting, there would have been a discontinuity between the ACS estimates from 2009 and those from 2010.
Similarly, CPS data before 2000 were not at all comparable to what came afterward, because the 2000 census results had substantial improvements in coverage over the 1990 census, especially for the Hispanic population. So we also went back and re-weighted all the data from the 1990s as well. With these re-weighted datasets, we have an internally consistent set of estimates stretching from the 1995 CPS through the most recent ACS, 2017.
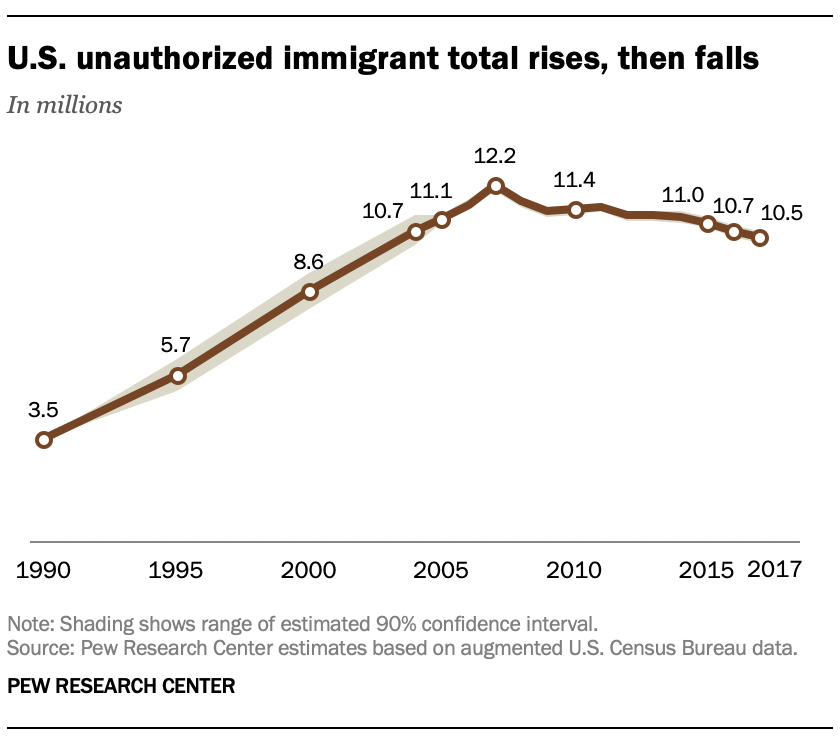
In the graphs from your June 2019 estimate of the unauthorized immigrant population, it sure looks like the line showing the population over time goes down from the 10.7 in 2016 to 10.5 million in 2017. So why don’t you say that the numbers went down for that year?
These numbers come from a sample survey. Such surveys don’t interview everyone in the country; they only interview a sample of the population. The sample results may be different from what we would get if we interviewed everyone. Not only that, but the results can vary from sample to sample. That’s what we mean when we talk about a margin of error.
In the case of these estimates, the margin of error is pretty large relative to the year-over-year changes. What that means is that what appears to be a change could be just randomness related to the characteristics of the sample. We need to see a big enough change before we can decide that it’s real. Even though the margin of error for the ACS is considerably smaller than the CPS, the apparent difference of 200,000 between 2016 and 2017 falls within the margin of error.
How do you produce data on the characteristics of unauthorized immigrants, such as time living in the U.S. or level of education?
What we do at Pew Research Center is an extension of work that was developed when I was at the Urban Institute and worked very closely with a researcher named Rebecca Clark on these methods. After making the initial estimates, we know that in 2017 there are more than 10 million unauthorized immigrants who appear in the survey. What Rebecca and I did was to take it another step and ask which of the respondents in the Census Bureau’s survey are the ones most likely to be unauthorized immigrants.
The survey we currently use – the American Community Survey – says there are more than 40 million immigrants currently in the country, and we have individual-level data representing them. Our methods allow us to sort the immigrants in the survey to determine which are almost surely lawfully present in the U.S., and which are most likely to be unauthorized immigrants, by looking at where they were born, when they came to the U.S., how old they are, how they are related to other people in their households, what kinds of jobs and income they have, and whether they are getting government benefits, among other factors.
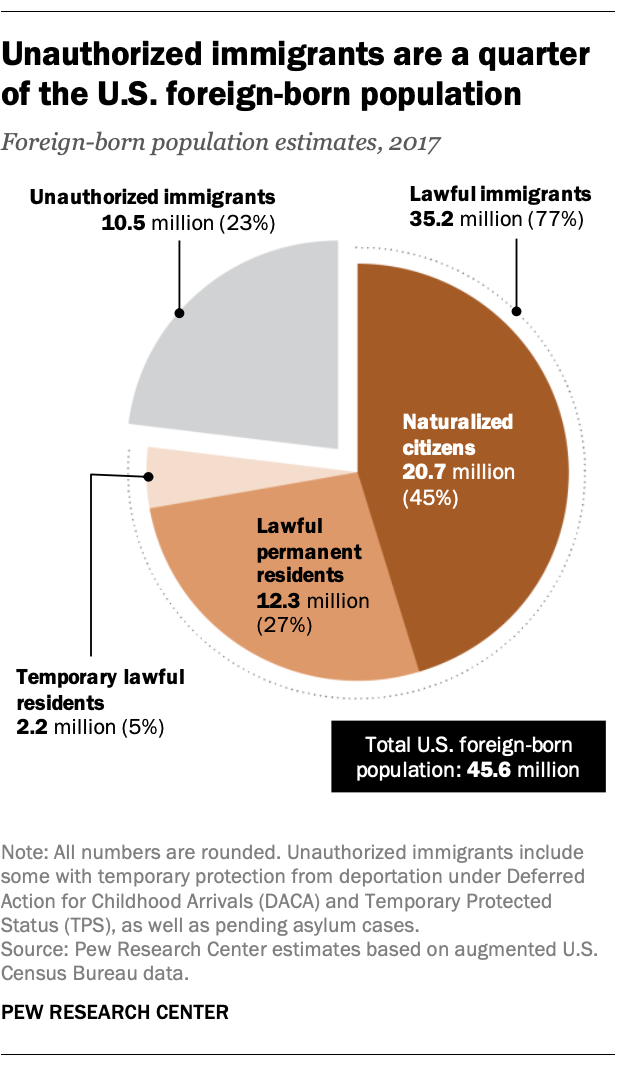
By putting all of those characteristics together, we go on to sort and separate them into immigrants likely to be here legally and those likely to be unauthorized immigrants. We categorize enough individuals as unauthorized immigrants until we get the 10.5 million estimated to appear in the 2017 ACS. The resulting dataset provides detailed information not only on the number of unauthorized immigrants, but also their characteristics and where they live.
Note: This is an update of a post originally published Sept. 20, 2016. The headline was updated Aug. 22, 2025, when a revised version of this Q&A was published.
